IoT Solution Ecosystem

Smart Energy Managementcontrol from generation to consumption, at a glance.

See every step of an energy flow that constantly changes direction — from the sun to the grid, from the battery to the vehicle — on one screen. Nu Platform makes the whole energy chain, from the point of generation to the point of consumption, real time, measurable and reportable.

01 / 10

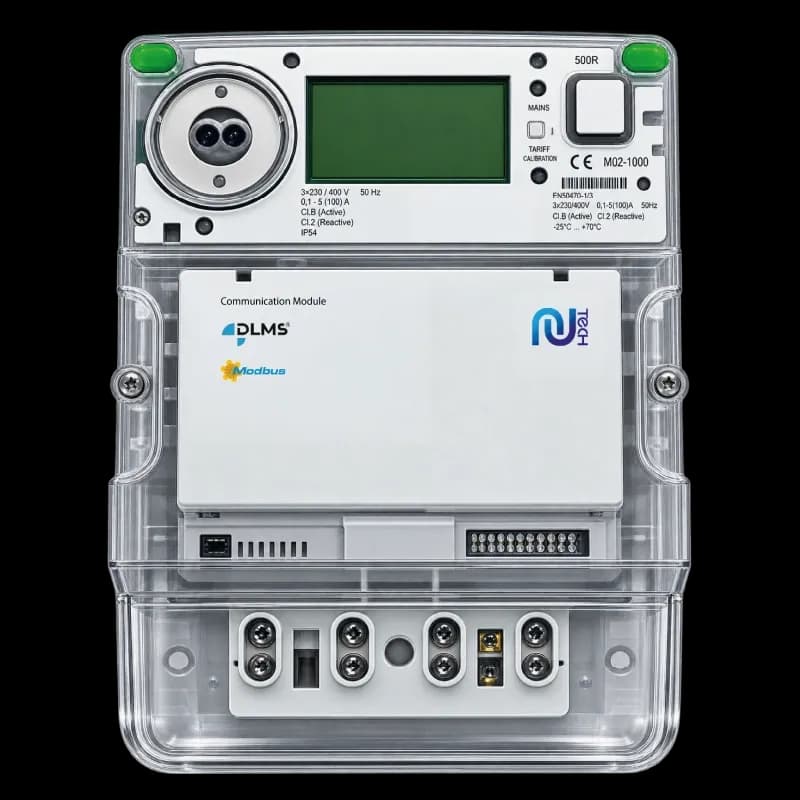
Remote Meter Monitoring

Catch a leak within hours, without going to the field.

Reading electricity, water and gas meters automatically, without visiting the field, removes human error, produces accurate billing and detects loss and theft immediately.

  • Leak detection from days to hours
  • Field staffing cost removed
  • Measurable loss rate
  • Remote reading of electricity, water and natural gas meters
  • Live monitoring, analysis and reporting on the central platform
  • Instant alarms for excess consumption, faults and leaks

loss %

Loss-and-theft rate and reading accuracy become measurable
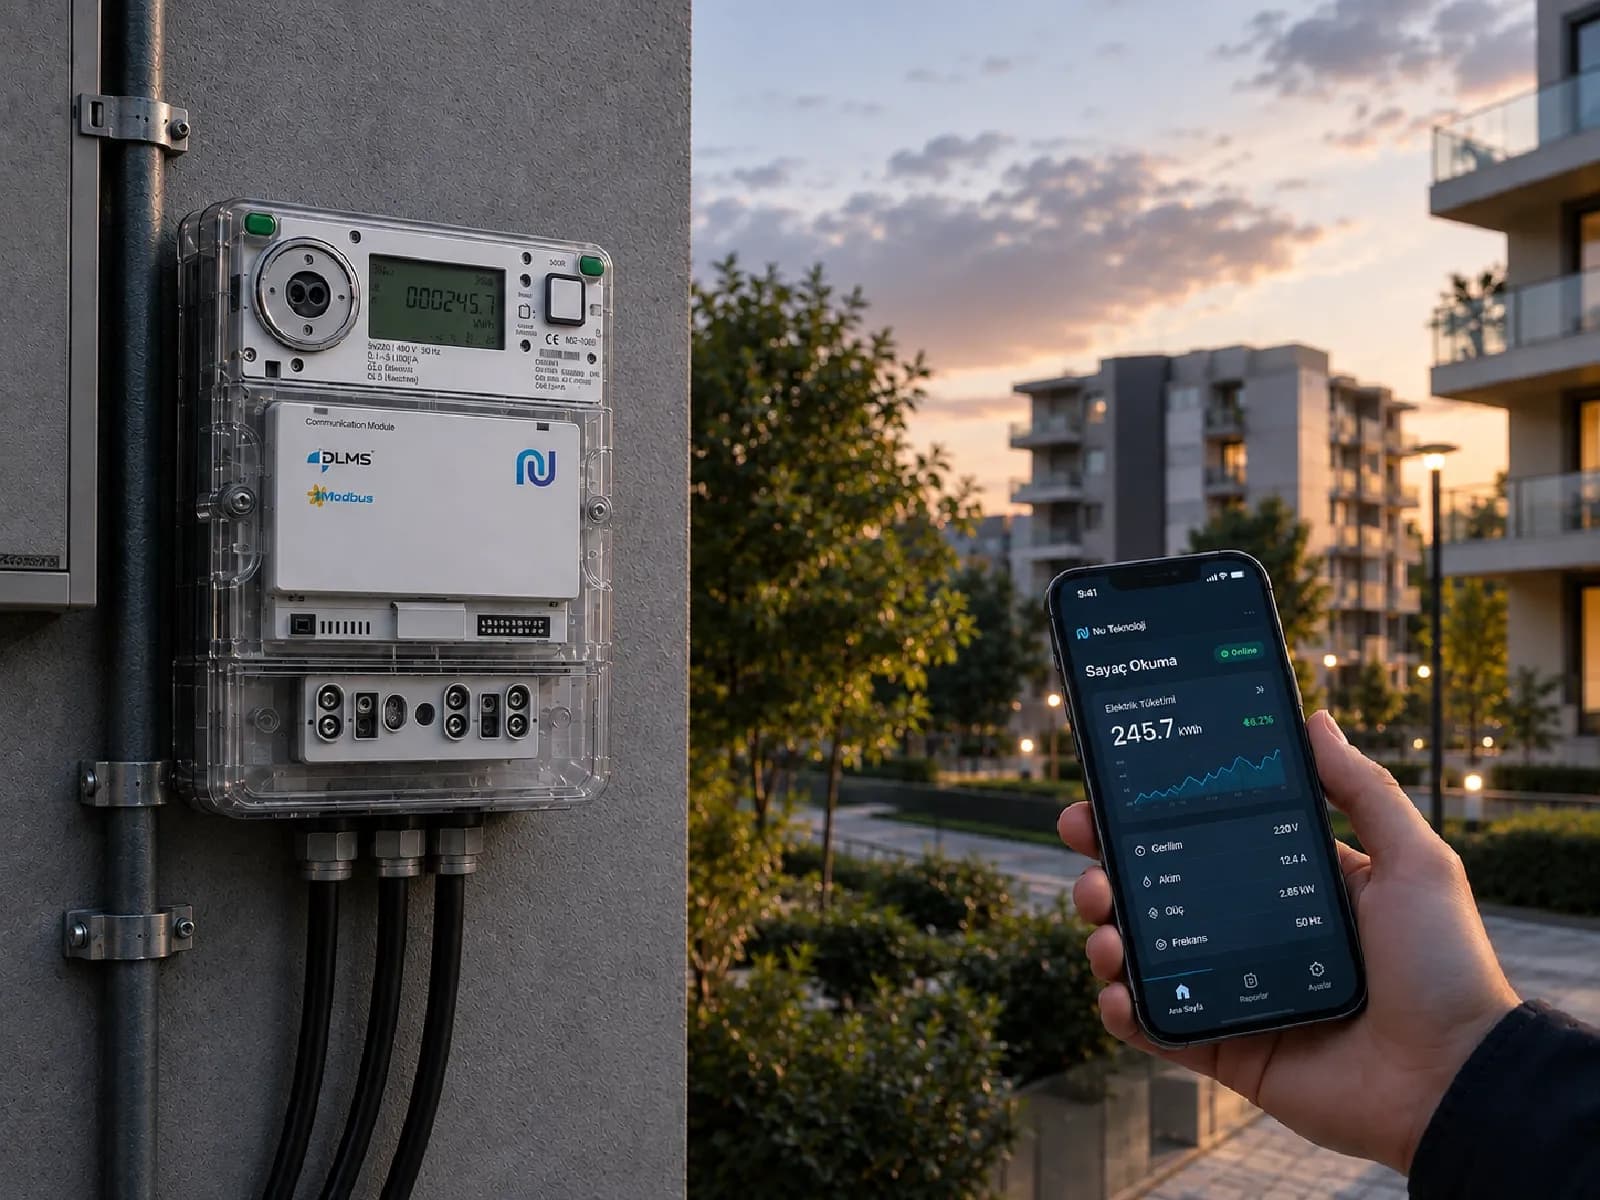
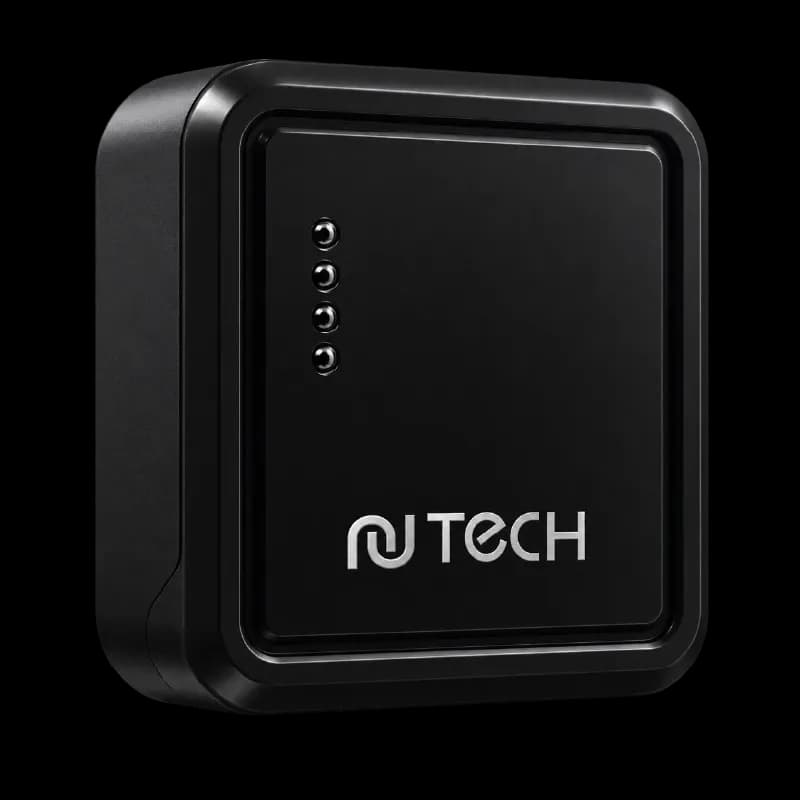
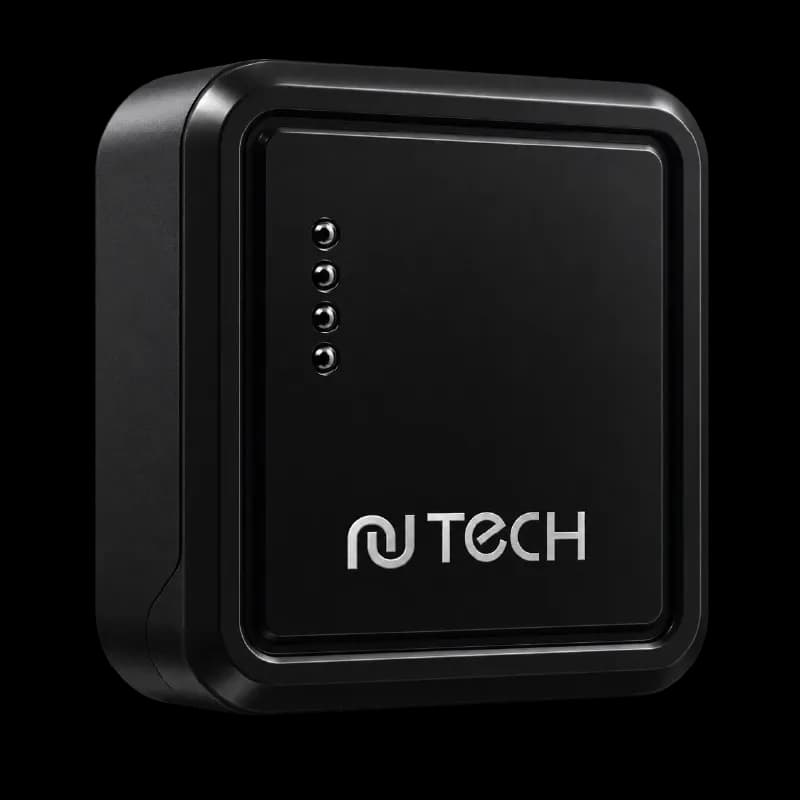
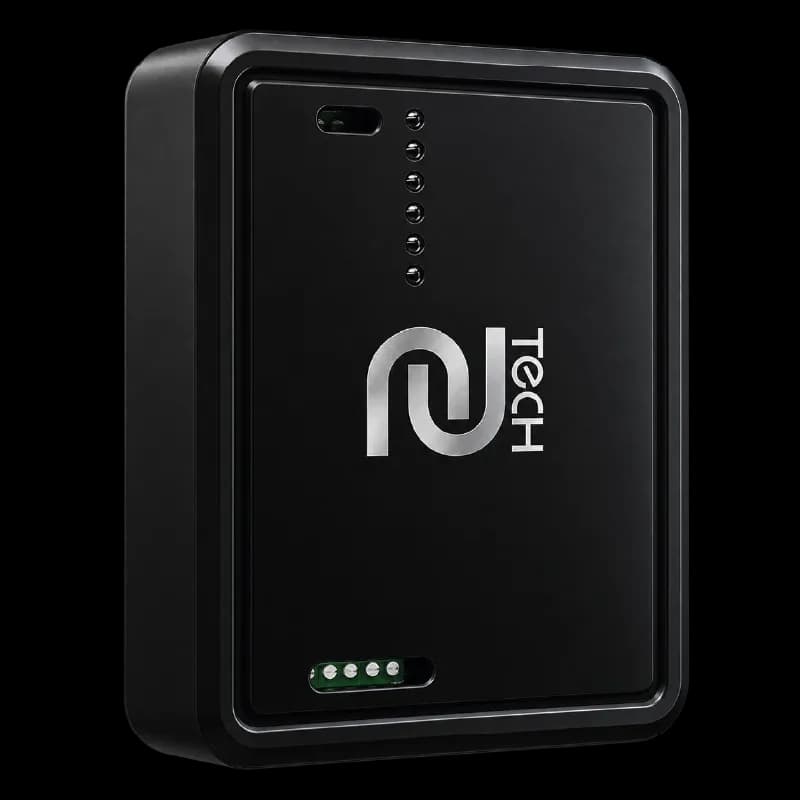
Remote Meter Monitoring — Meter Module
02 / 10

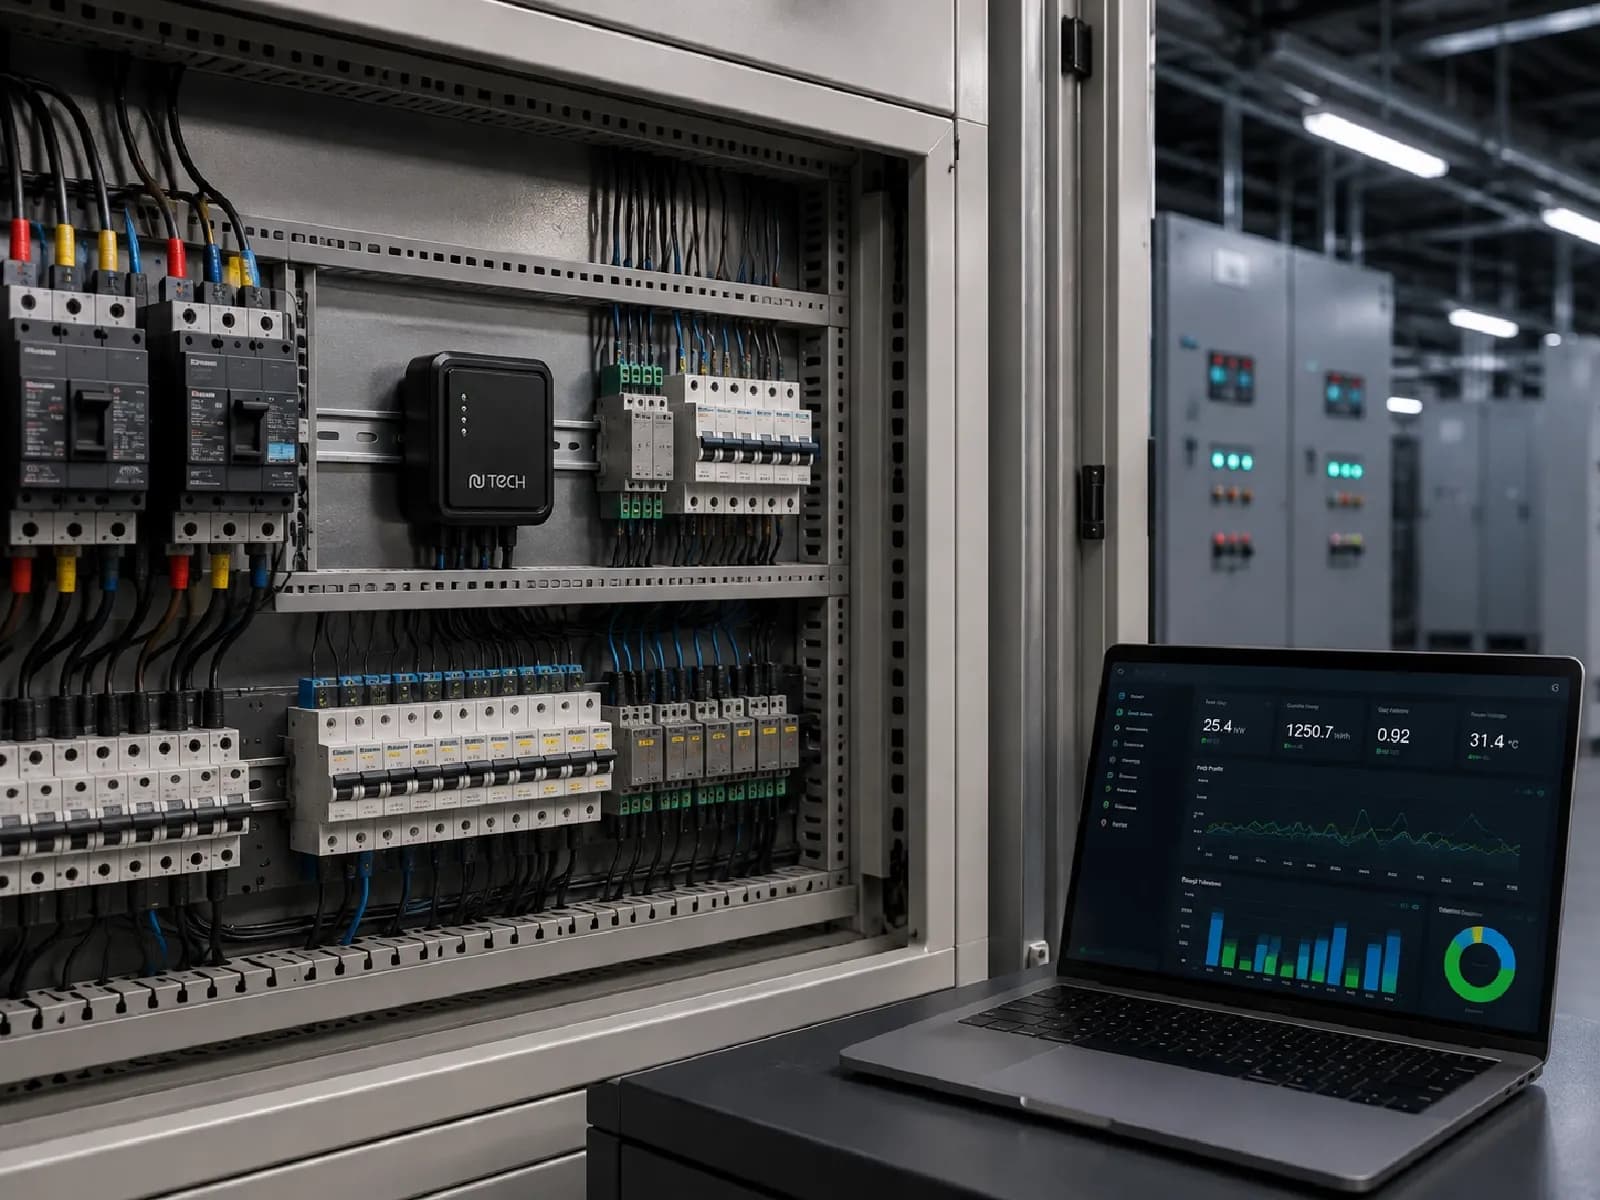
Energy Monitoring and Management

See where your energy bill actually goes.

Monitoring electricity consumption at main panel, sub-panel, line and equipment level; analysing live power, energy intensity, load profile and consumption trends. Once every consumption point is visible on its own, the inefficient ones show themselves.

  • Hidden consumption identified
  • Peak demand overrun prevented
  • AI-based anomaly detection
  • Live power, load profile and consumption trend analysis
  • Peak demand monitoring, preventing penalty charges
  • Line and equipment level inefficiency detection

live

Every consumption point is monitored separately and in real time

Technical Note

Unusual consumption patterns are detected using artificial intelligence; unmetered consumption and equipment faults are identified in advance.

Energy Monitoring and Management — Energy Analyser
03 / 10

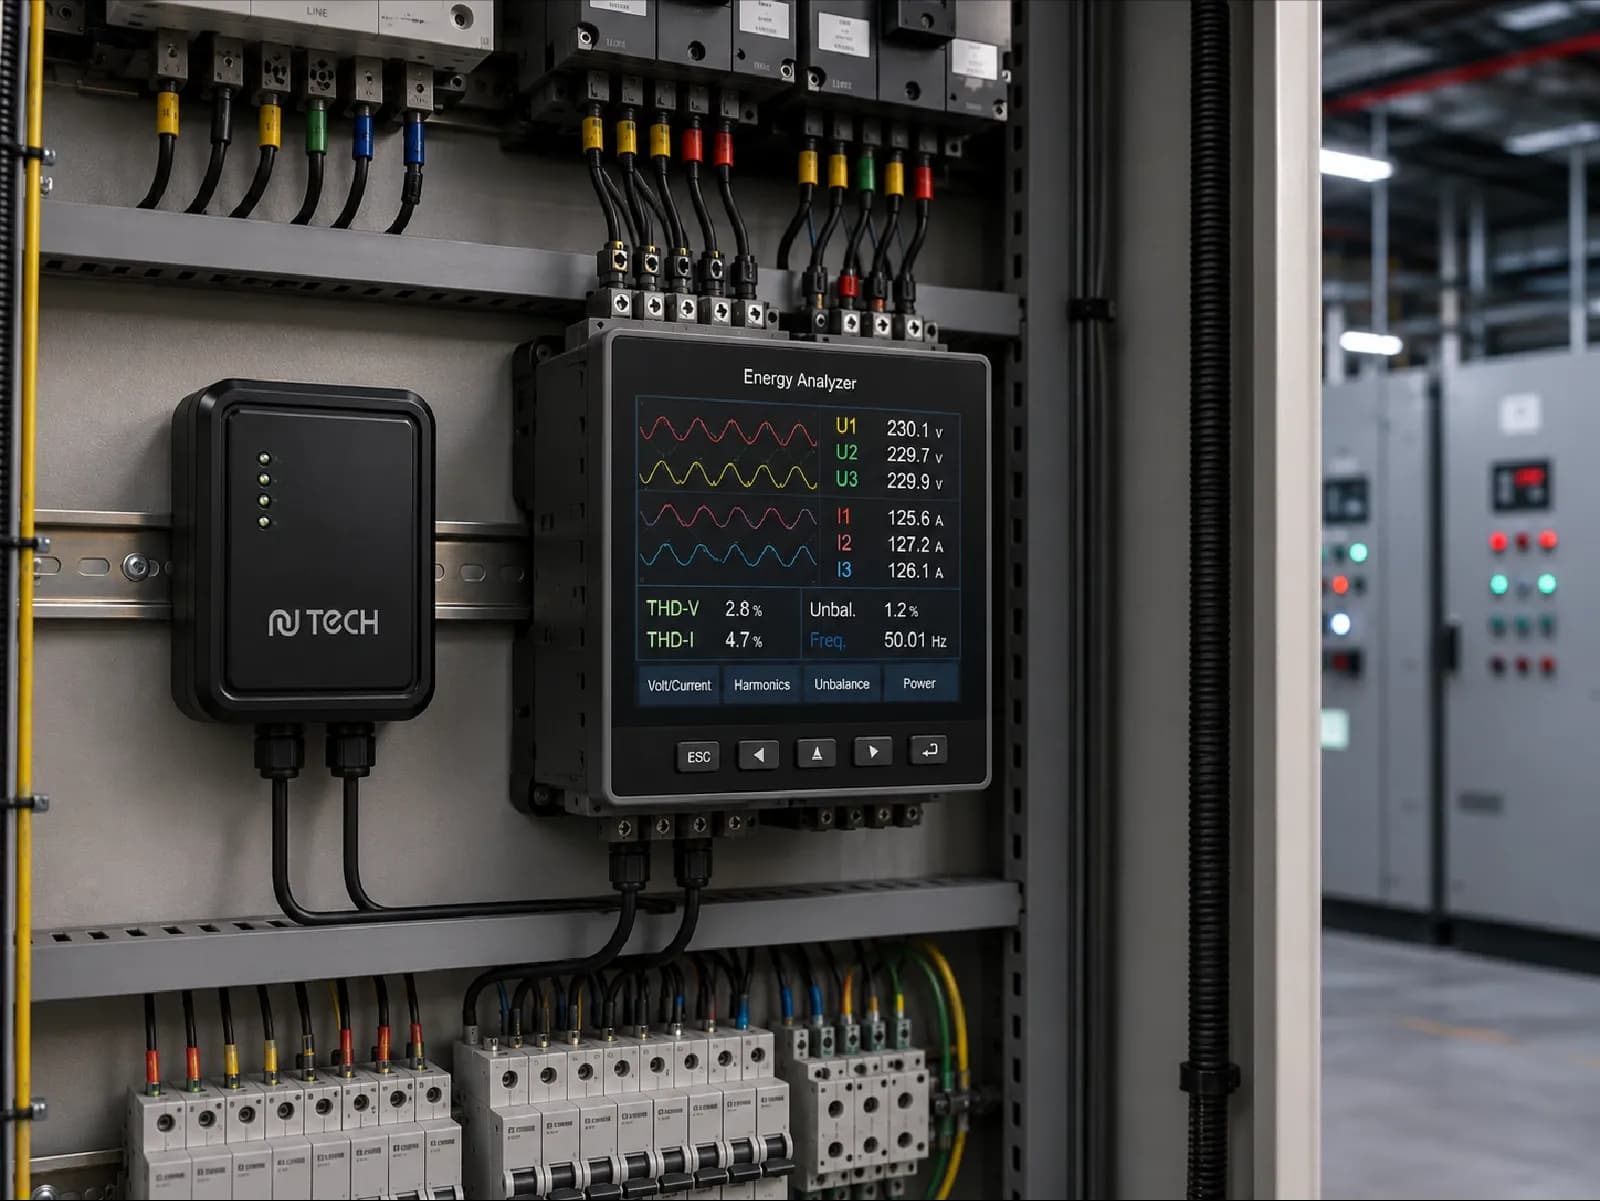
Power Quality Monitoring

Measure how clean the power you draw from the grid really is.

Continuous monitoring of parameters such as voltage fluctuation, harmonic distortion and phase imbalance. When these are not monitored, equipment life shortens and an unnoticed energy loss builds up.

  • Harmonic monitoring
  • Early risk detection
  • Equipment life protection
  • Voltage and harmonic distortion monitoring
  • Early detection of phase imbalance
  • Prevention of risks that shorten equipment life
Power Quality Monitoring — Power Quality Device
04 / 10

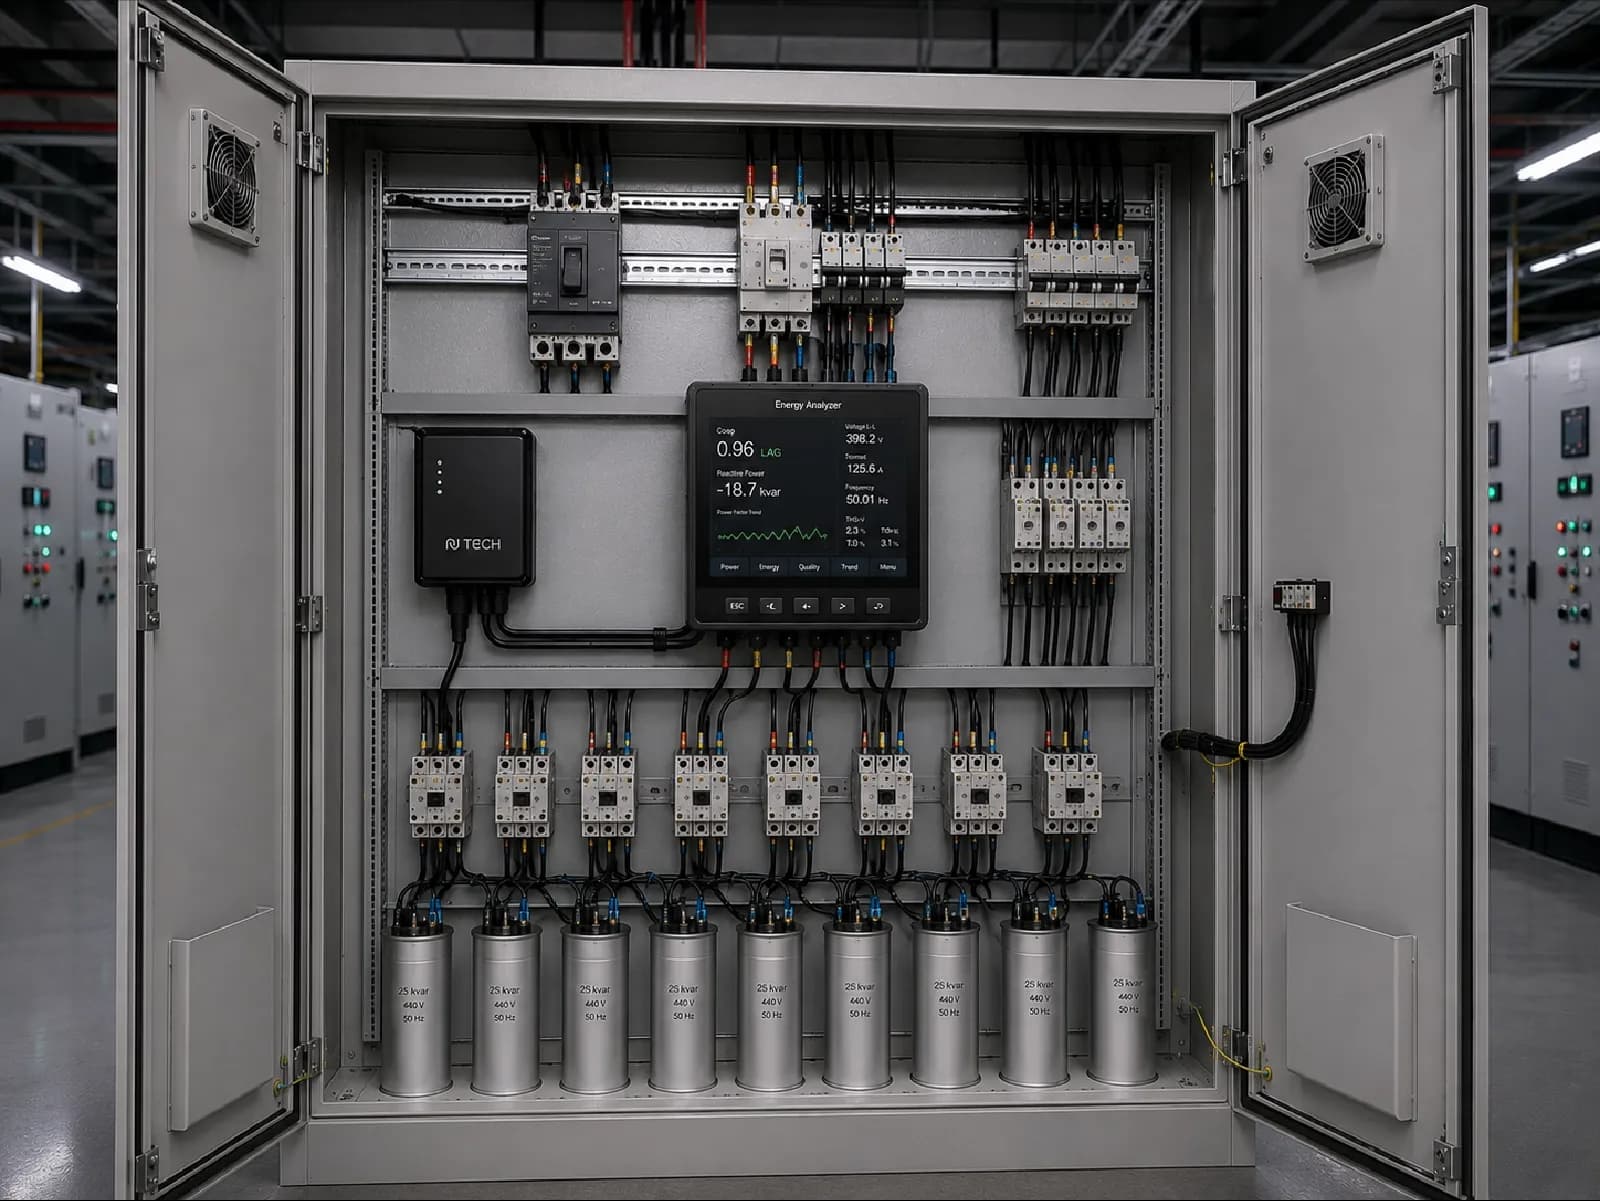
Reactive Power and Compensation Monitoring

Remove the energy cost you cannot see.

Phase imbalance and power quality problems are identified at an early stage, so losses are minimised. When cos phi (the power factor) is monitored and improved, the extra costs caused by reactive energy fall directly.

  • Cos phi improvement
  • Reactive penalty avoided
  • Early loss detection
  • Continuous cos phi (power factor) monitoring
  • Reduction of extra costs caused by reactive energy
  • Minimisation of losses caused by phase imbalance

cos phi

Monitoring the power factor lowers reactive energy cost

Reactive Power and Compensation Monitoring — Reactive Power Sensor
05 / 10

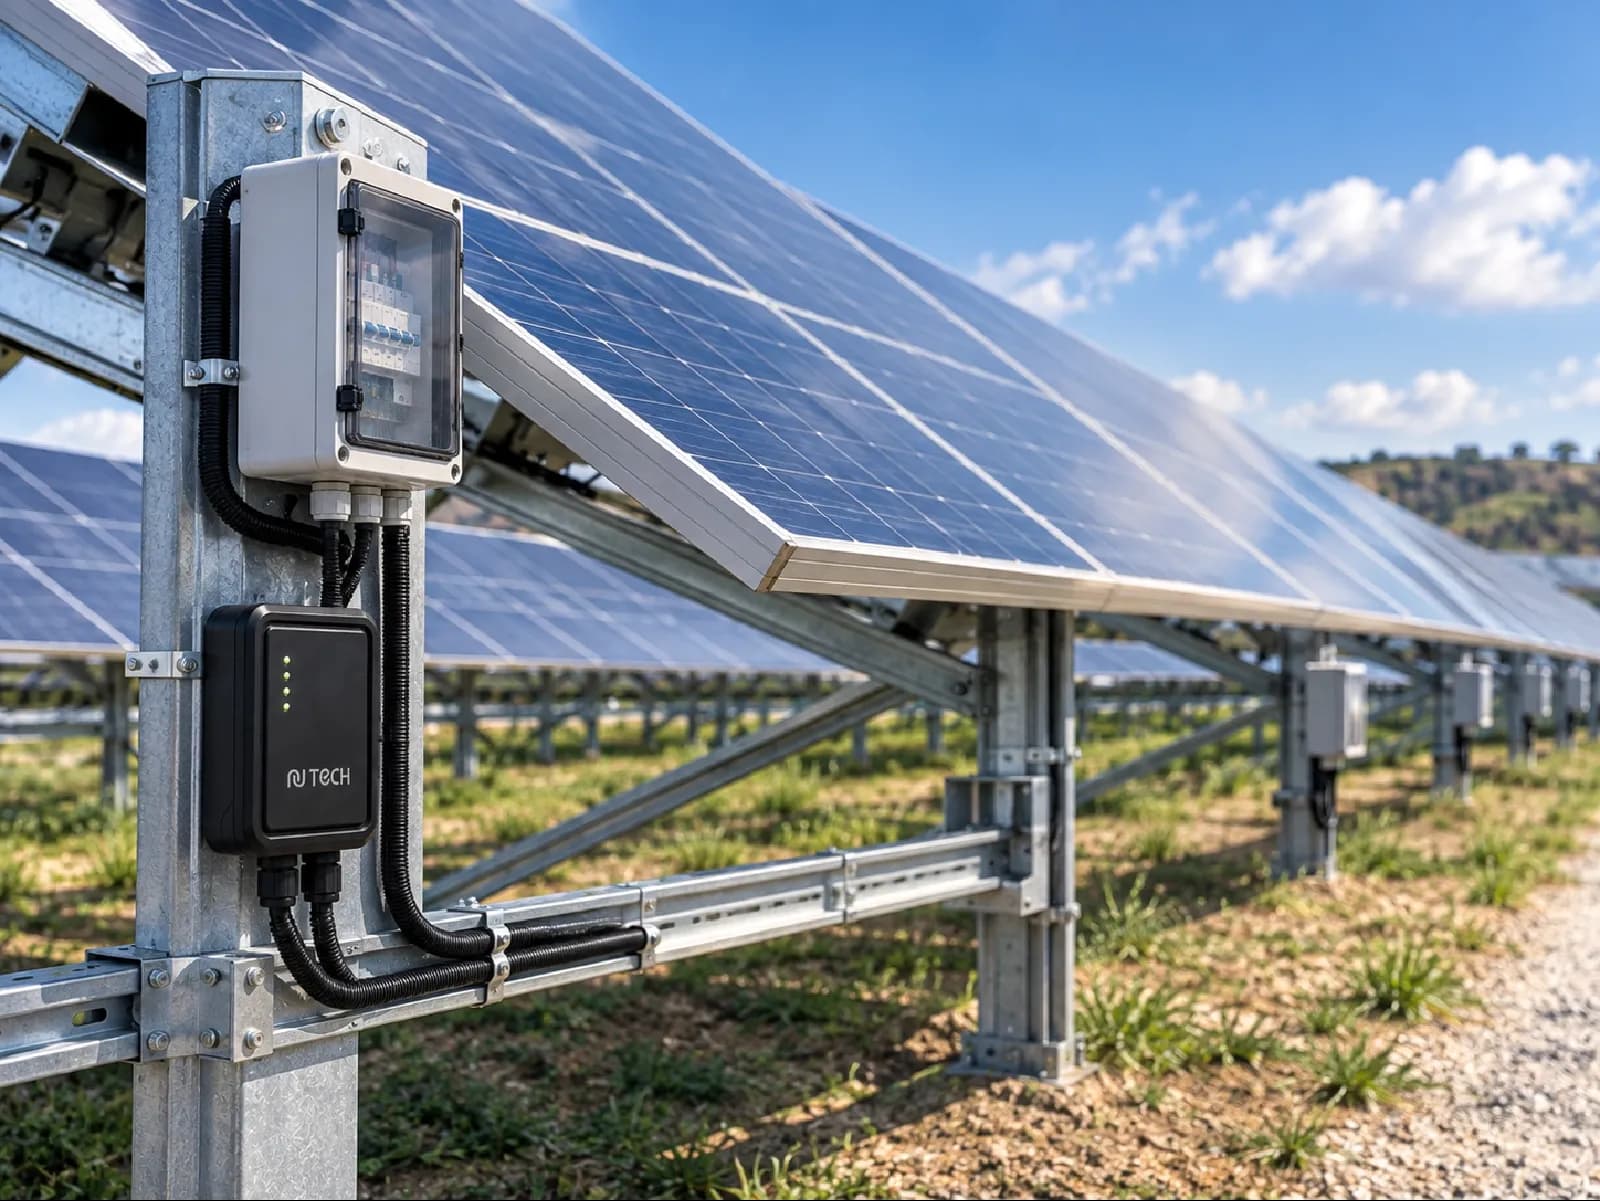
Solar Plant Efficiency Monitoring

Know how much every panel is producing.

Panel-level efficiency tracking identifies losses caused by shading, soiling or faults; production and consumption are compared live so the net energy balance is visible.

  • Production vs. consumption
  • Self-consumption analysis
  • Panel-level performance
  • Live comparison of production and consumption
  • Self-consumption analysis
  • Panel-level efficiency and loss detection

panel

Panel-level performance monitoring pinpoints the source of a loss

Technical Note

The proportions and unit costs of energy taken from the grid, from solar and from generators are compared on the same screen.

Solar Plant Efficiency Monitoring — Solar Efficiency Sensor
06 / 10

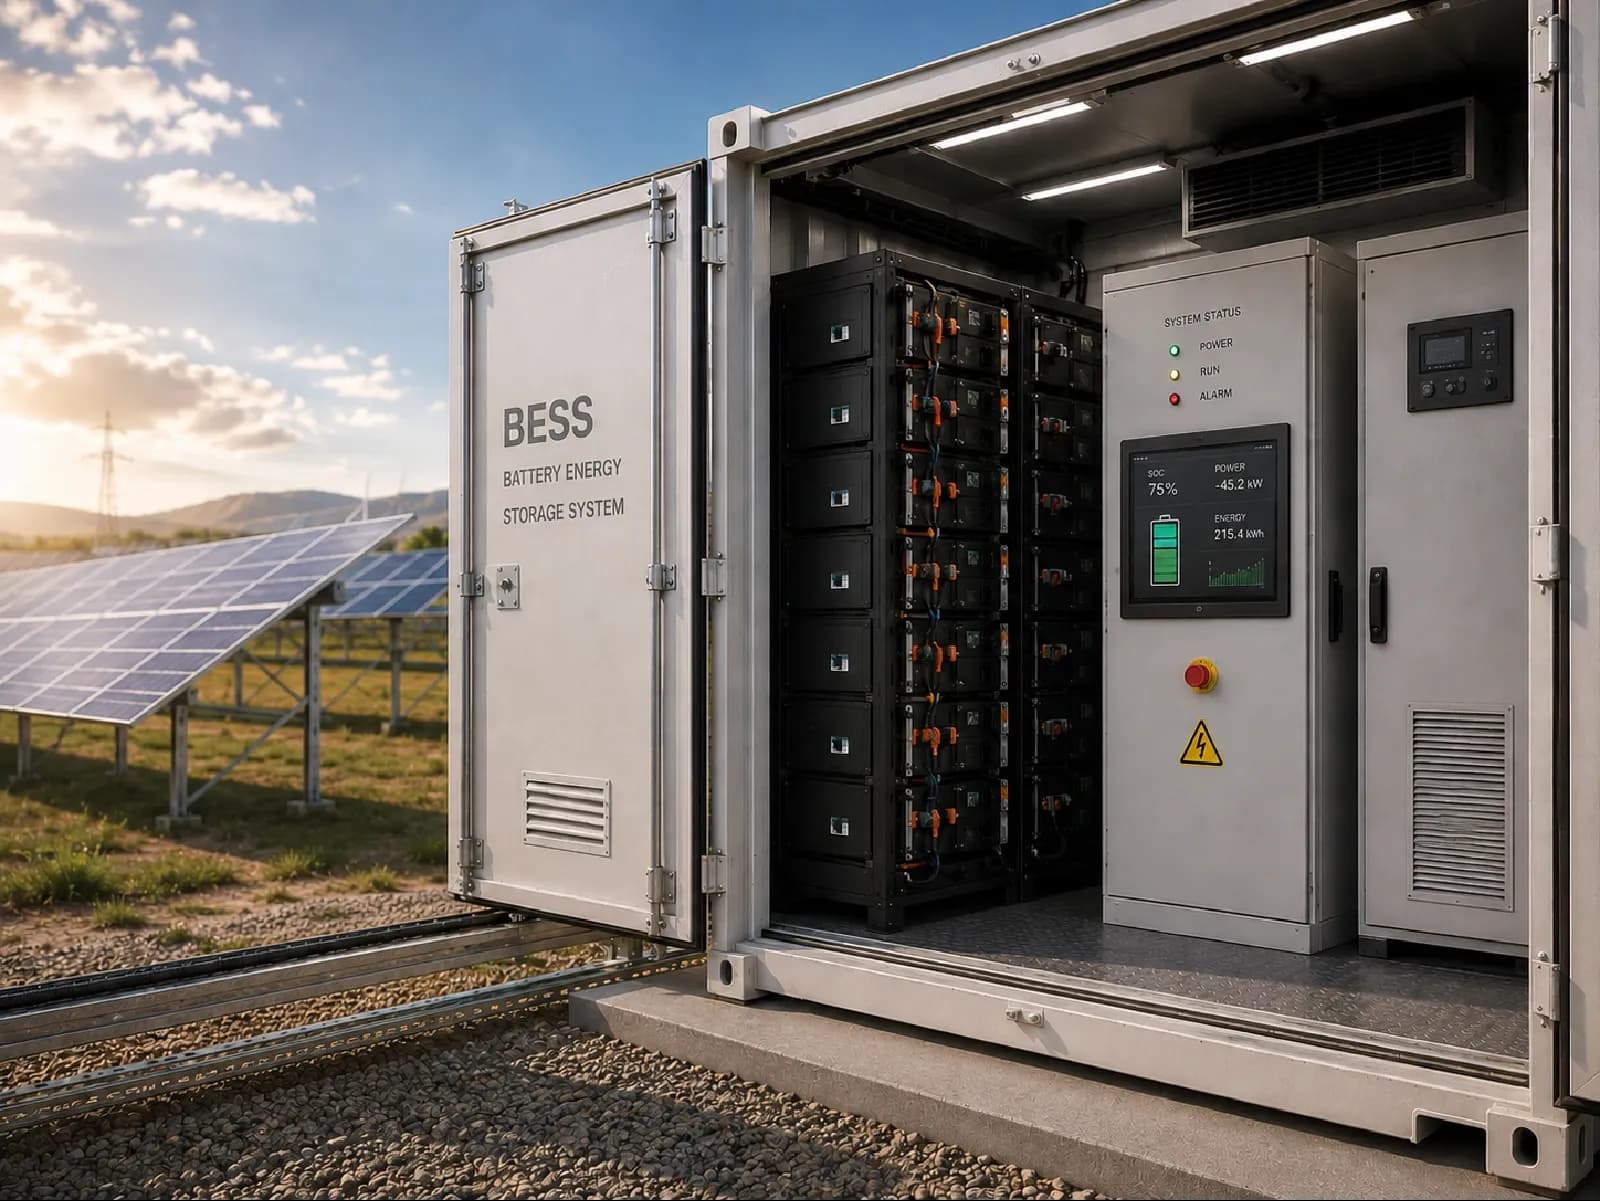
Energy Storage System Monitoring

Store the surplus sun for the moment you need it.

Monitoring the charge and discharge state, capacity health and usage efficiency of battery energy storage systems (BESS). The layer that manages storing surplus solar energy and bringing it back when it is needed.

  • Surplus energy put to use
  • Energy support during outages
  • Capacity health monitoring
  • Charge and discharge cycle monitoring
  • Automatic energy support during an outage
  • Capacity health and efficiency tracking
Energy Storage System Monitoring — BESS Unit
07 / 10

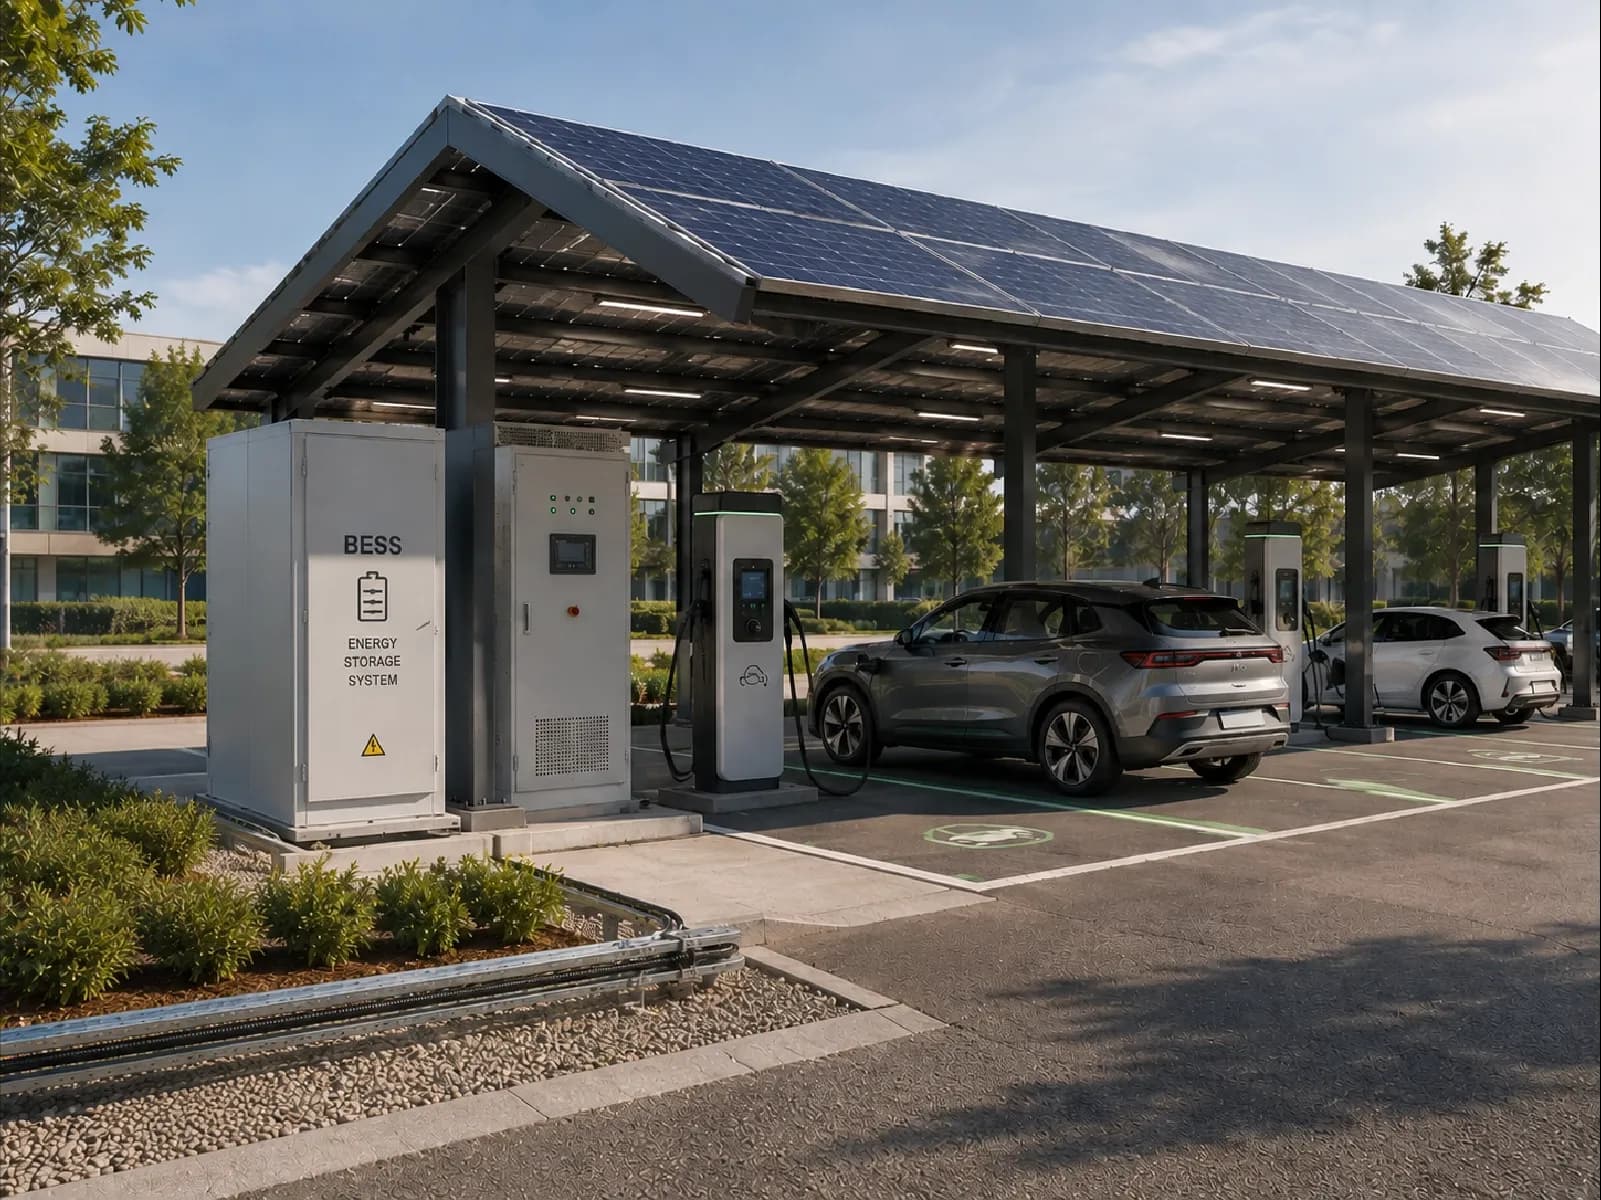
EV Charging Monitoring and Management

Let your charging point feed on sunlight, not the grid.

Usage tracking, remote monitoring and reservation of EV charging points; reduced grid dependency through solar-equipped carports and BESS integration.

  • Solar carport support
  • Dynamic load management
  • Automatic fault notification
  • Usage tracking, remote monitoring and reservation
  • Use of surplus solar energy through BESS
  • Automatic maintenance and fault notifications

BESS

With battery energy storage, service continues even during an outage

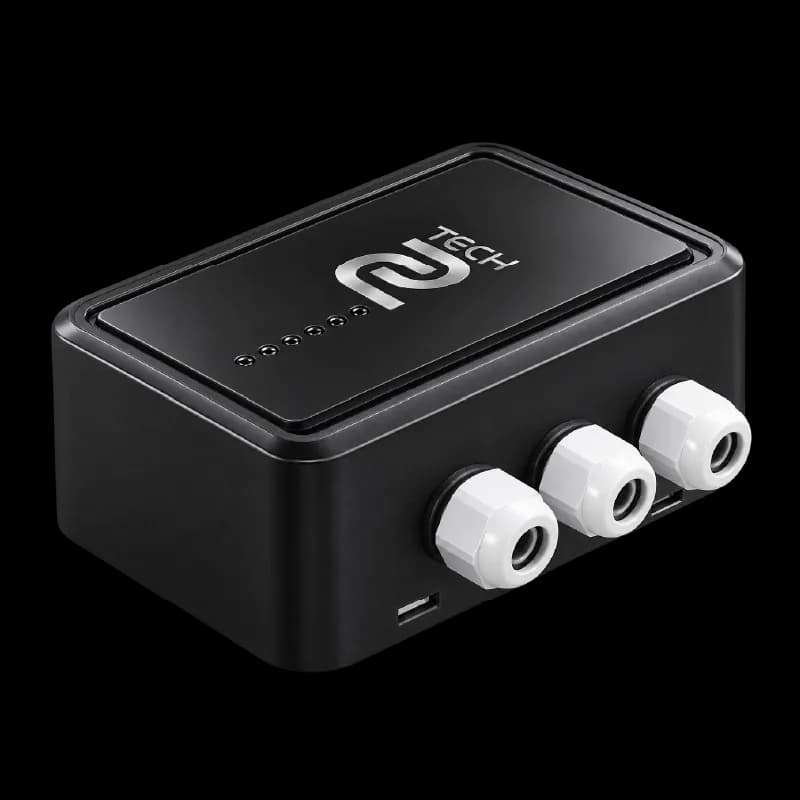
EV Charging Monitoring and Management — Off-Grid Charging Unit
08 / 10

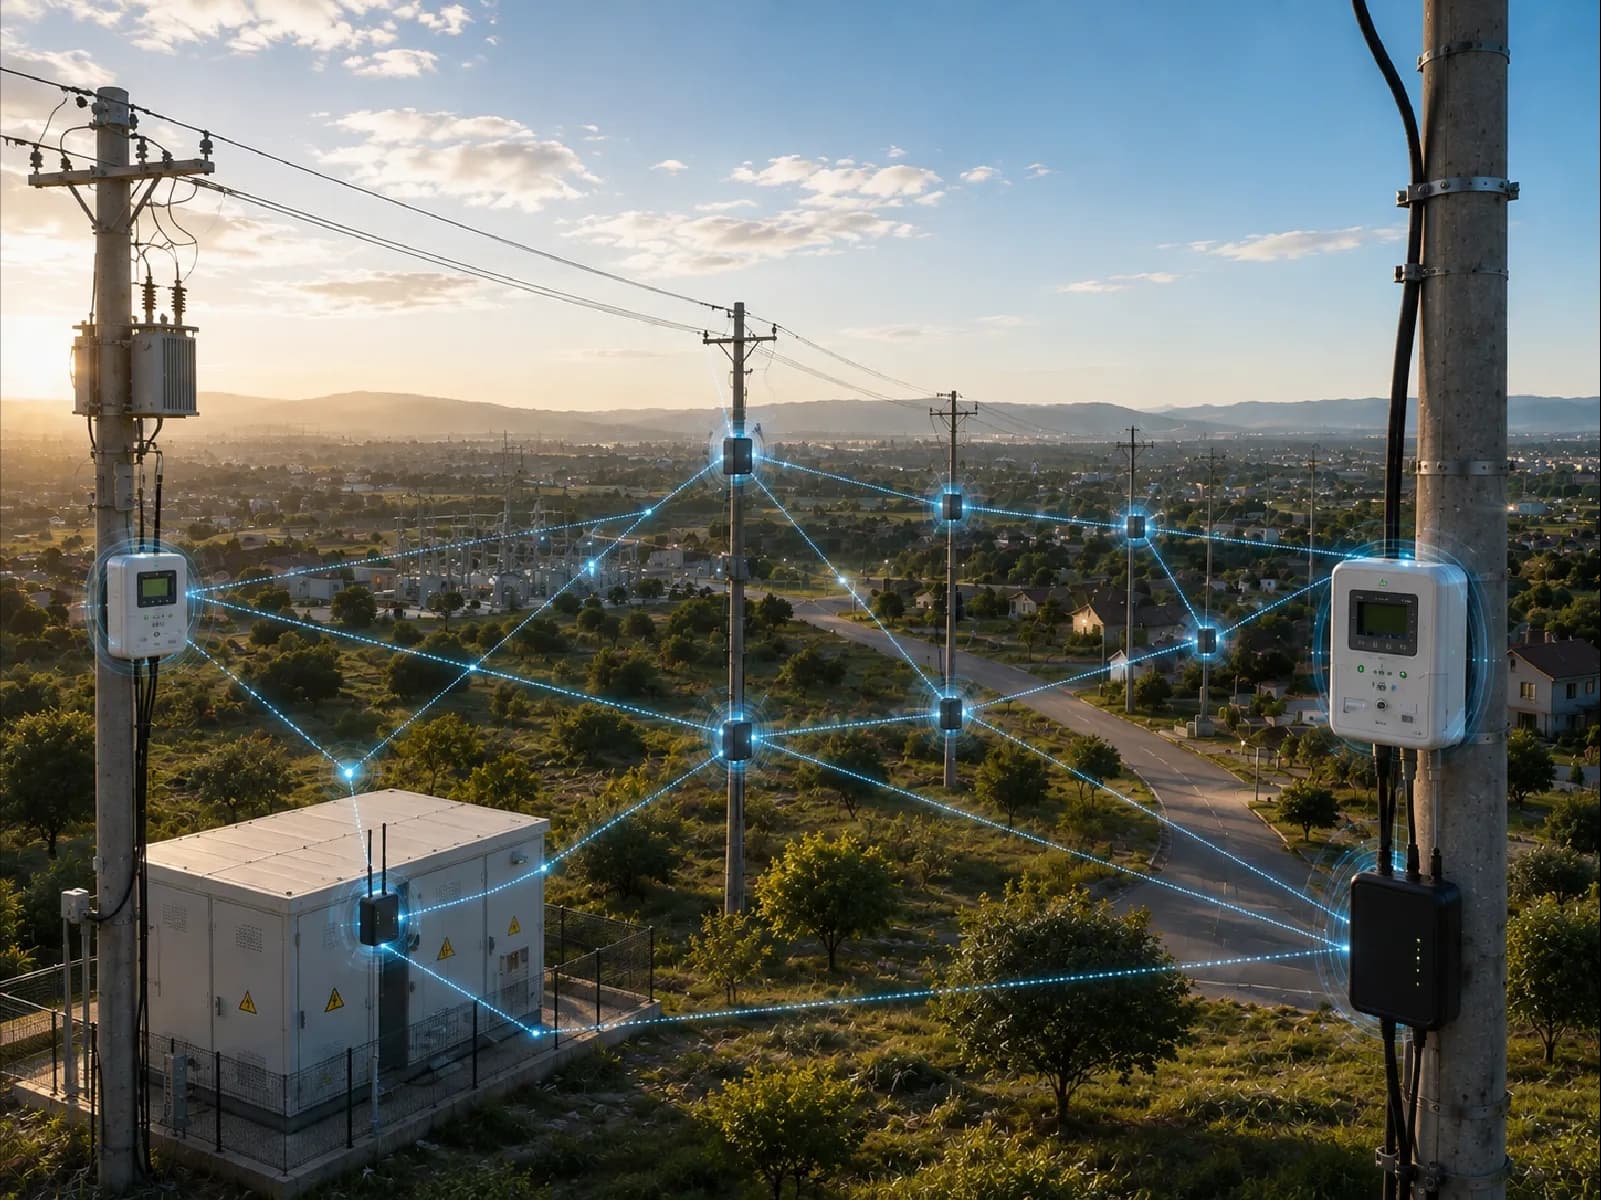
Smart Grid Applications

Let every point on the distribution line speak on the same network.

Meters, sensors and control points on the distribution line are connected to one another over the same communication backbone, so the grid becomes visible and manageable end to end and in real time.

  • End-to-end visibility
  • Mesh topology
  • Extending coverage area
  • Meters, sensors and control points brought onto one network
  • A self-healing mesh topology resilient to interruption
  • End-to-end AES-128/256 encrypted data transmission

Technical Note

In a DECT NR+ mesh architecture every node can act as a data carrier, an access point or a router; when one node loses its connection the network switches automatically to an alternative route.

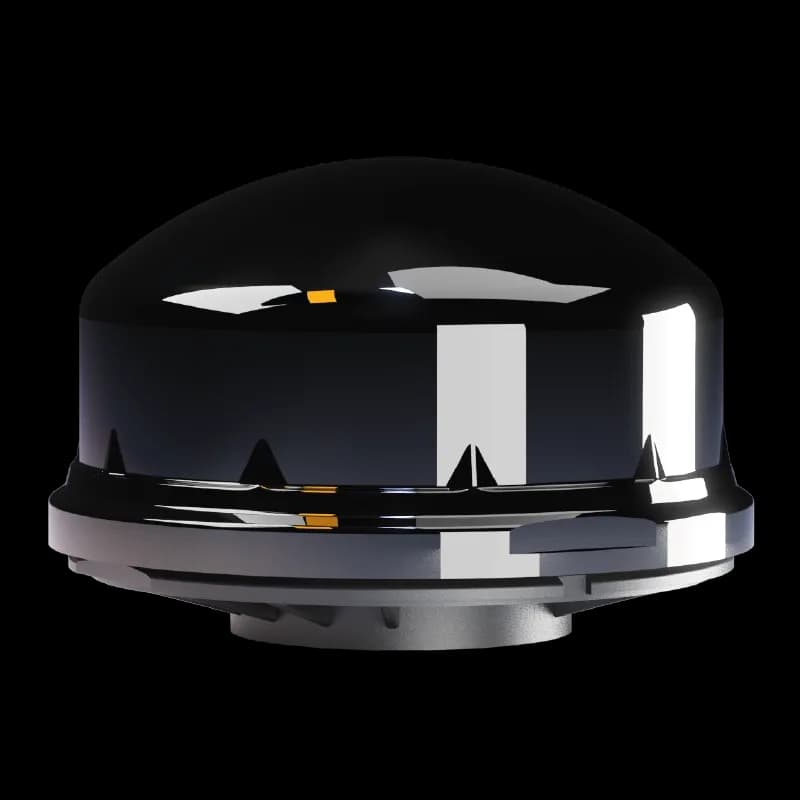
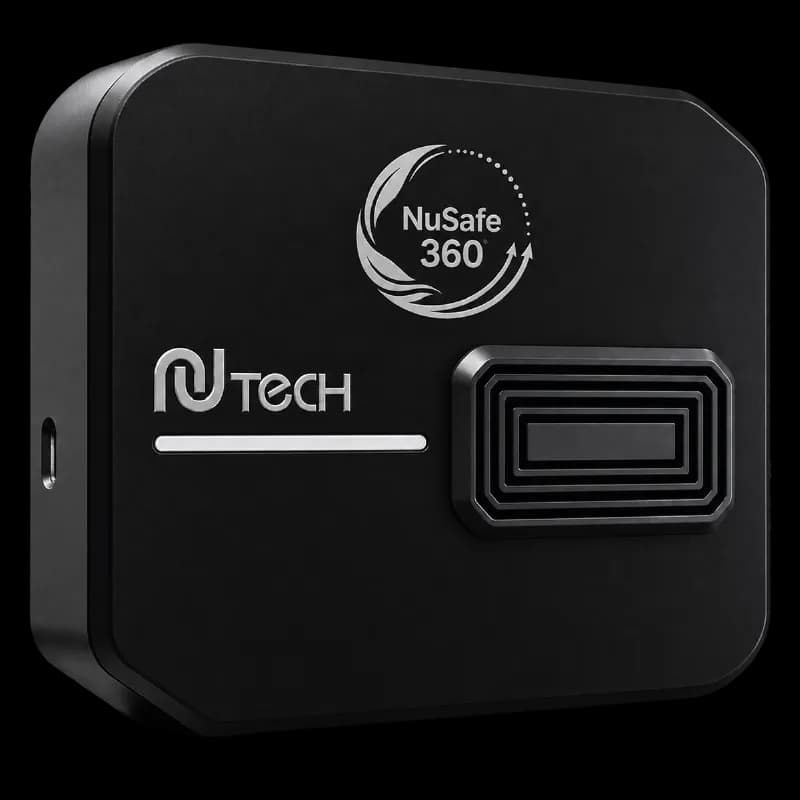
Smart Grid Applications — Mesh Node
09 / 10

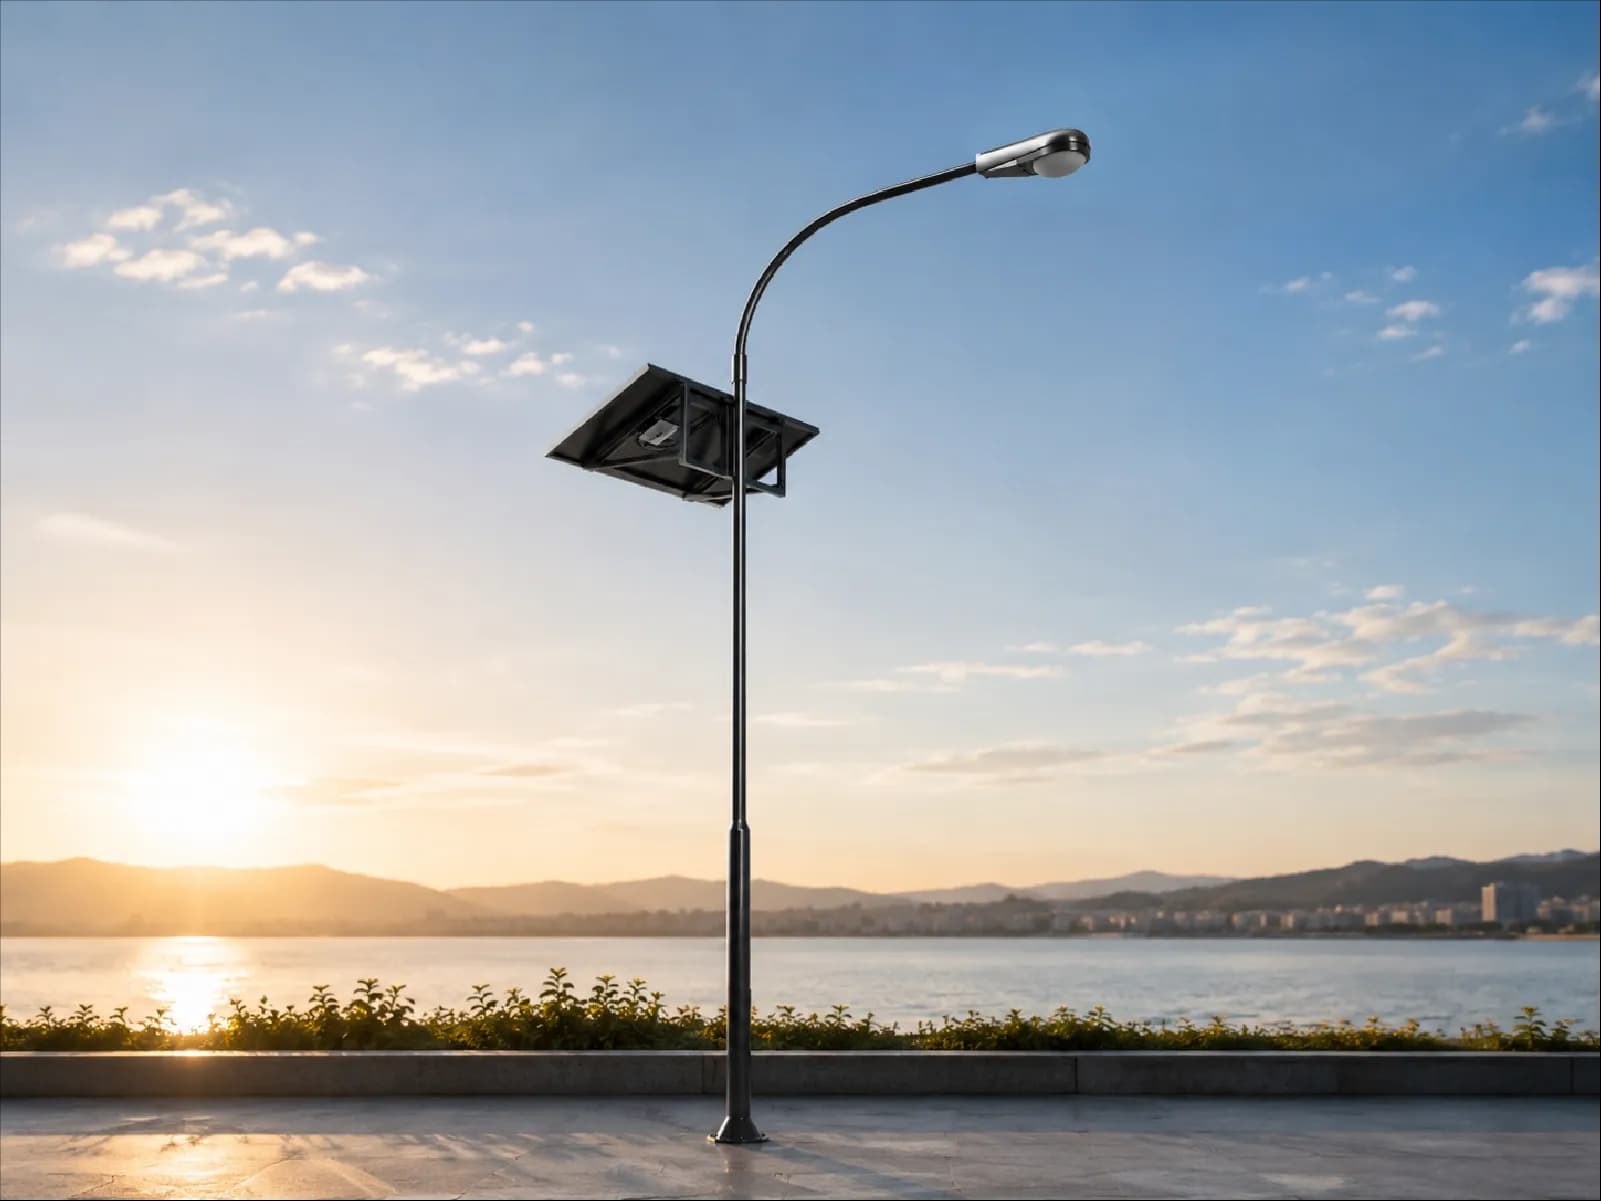
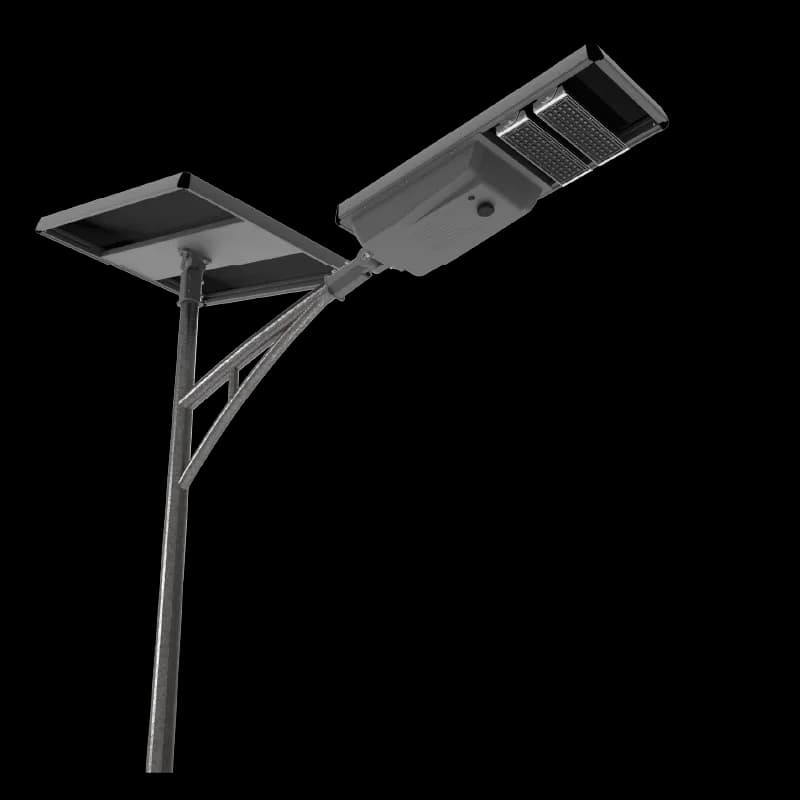
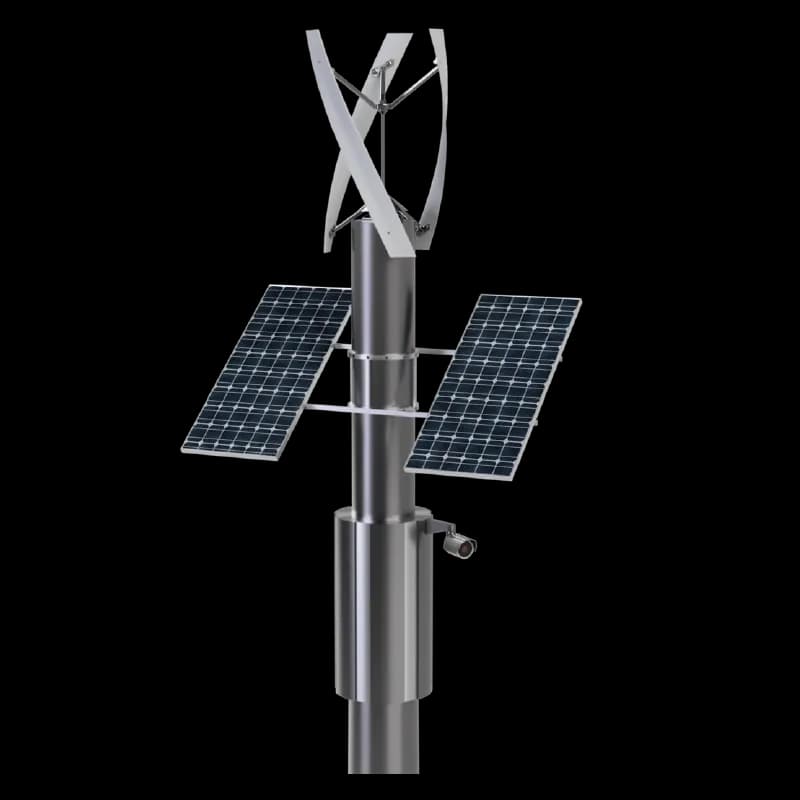
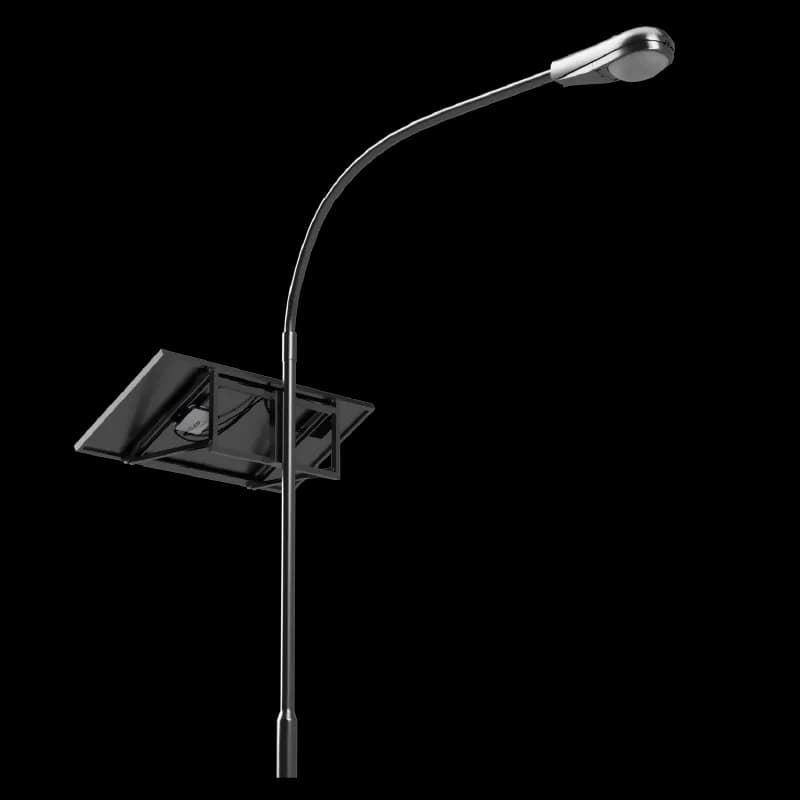
Solar-Assisted Smart Pole Solutions

Let every pole be its own power plant.

Smart pole solutions that turn each lighting pole into a small solar power plant, producing its own energy and running independently of the grid. Operating costs move close to zero.

  • Grid-independent structure
  • Near-zero operating cost
  • Minimum carbon footprint
  • A grid-independent structure producing its own energy
  • A solution for areas with no access to the electricity grid
  • Minimum carbon footprint and an environmentally sound approach

kWh/pole

Annual energy production, carbon emission reduction and cost saving are measured

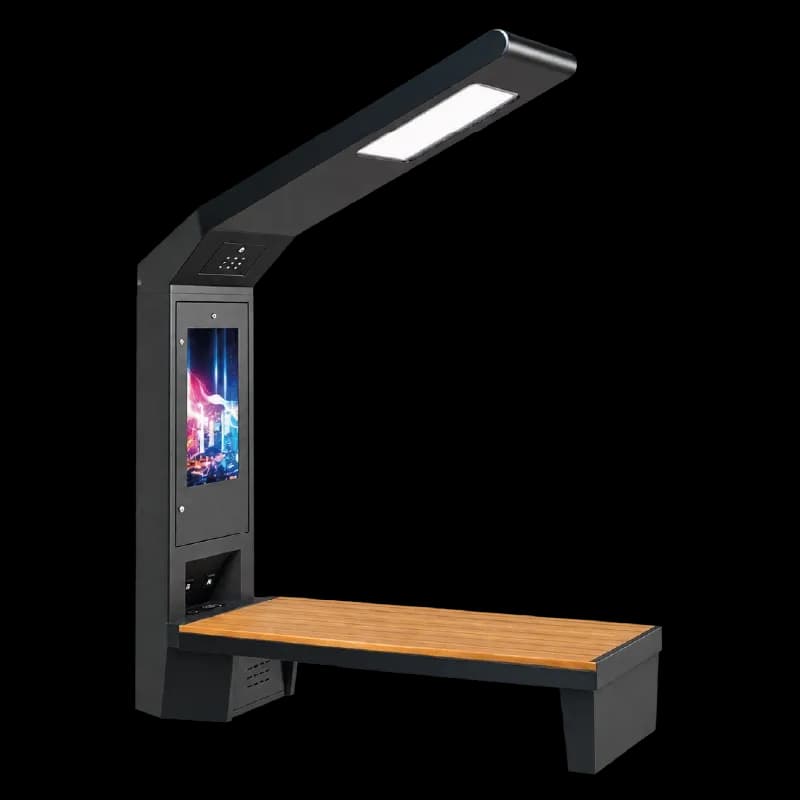
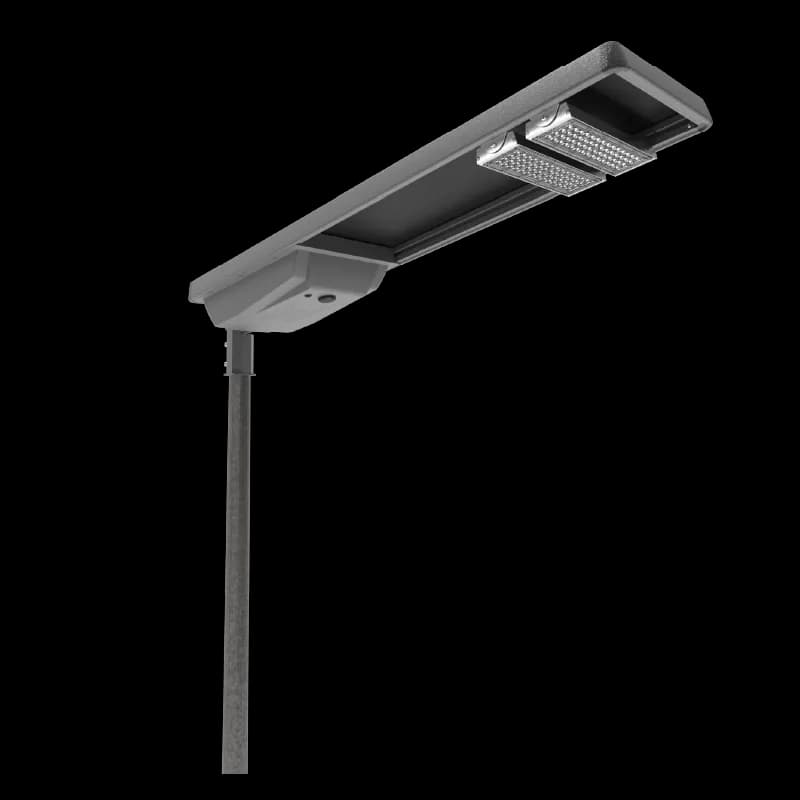
Solar-Assisted Smart Pole Solutions — Pole Solar System
10 / 10

Carbon and Sustainability Analytics

See every kilowatt with its carbon equivalent.

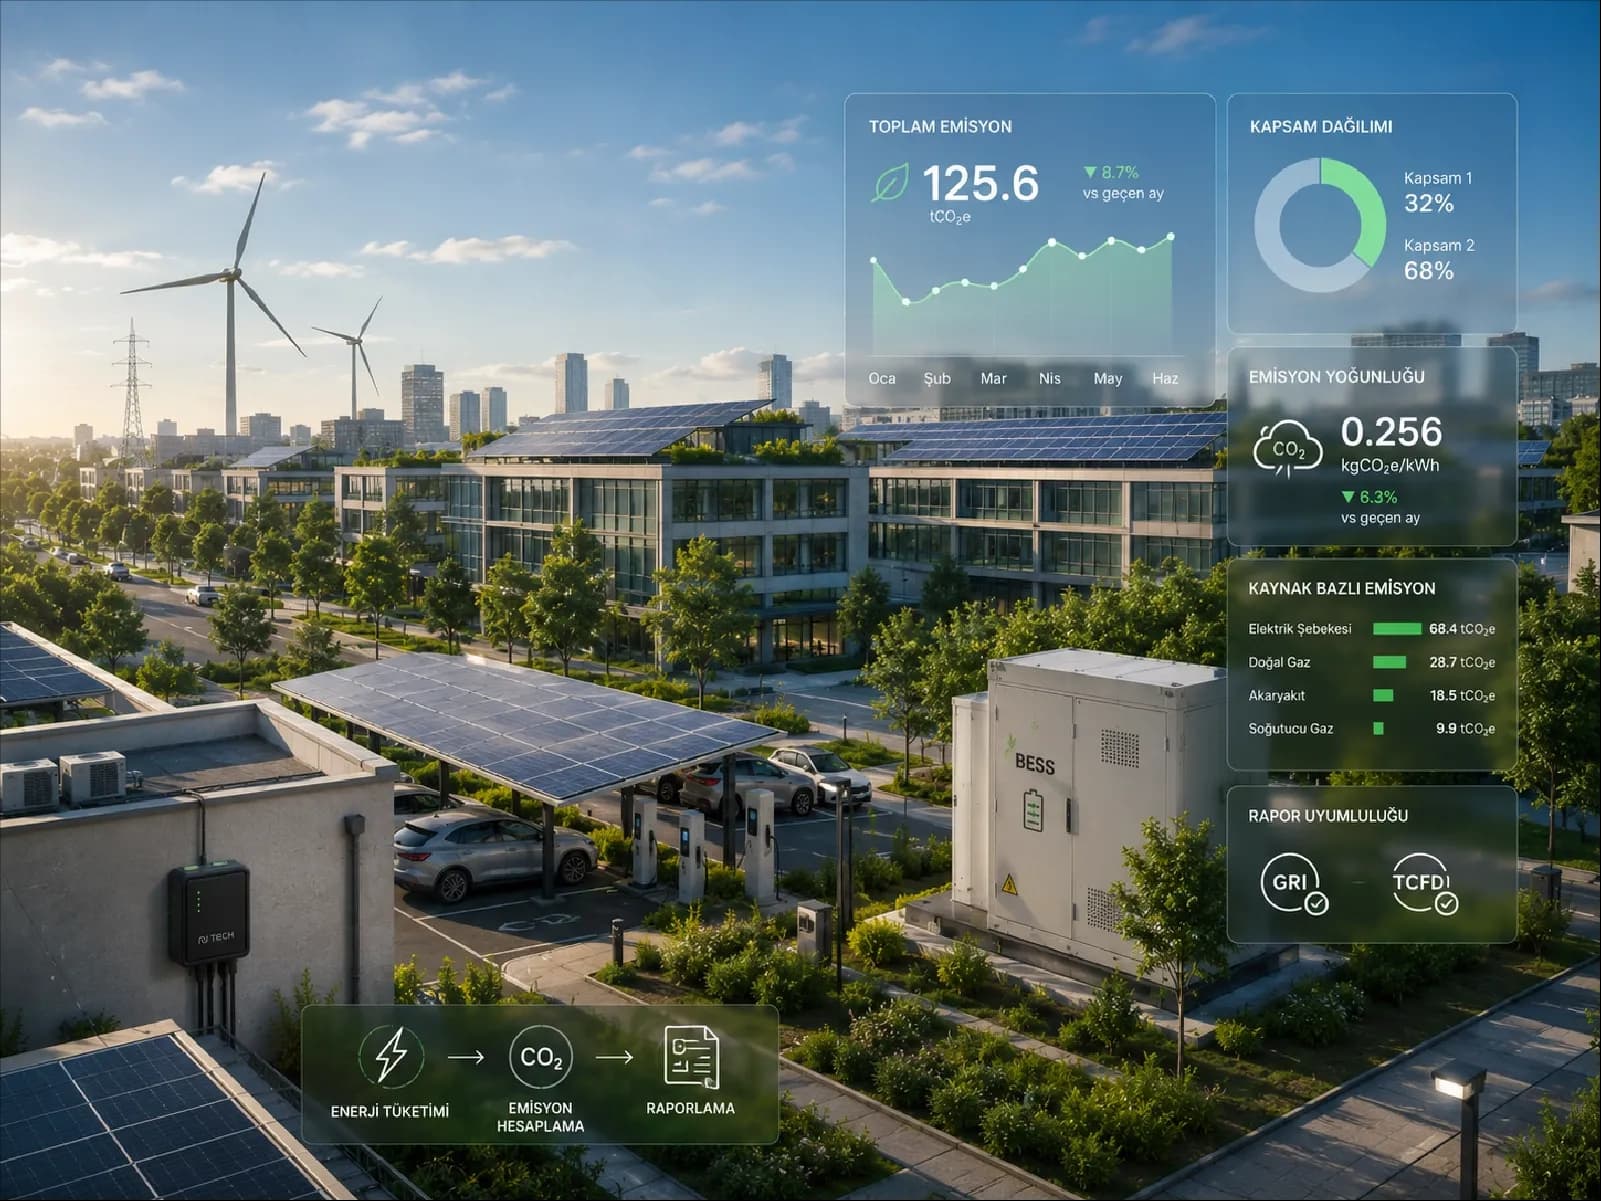
Every energy consumption point is converted automatically into a carbon emission value; Scope 1 and Scope 2 emissions are reported separately. Line and product level carbon calculation identifies which source carries the higher environmental cost.

  • Automatic CO2 conversion
  • Scope 1 / Scope 2 reporting
  • GRI / TCFD compliant output
  • Automatic conversion of energy into CO2
  • Product and line level carbon footprint calculation
  • Automatic reporting in line with international standards (GRI, TCFD)

GRI/TCFD

Automatically generated reports are produced in a format compliant with international ESG standards

Technical Note

Nu Platform converts energy consumption directly into carbon emissions, making statutory reporting obligations easier to meet.

Carbon and Sustainability Analytics — Carbon Analytics
Nu Platform

Ten modules, one energy picture.

From generation to consumption and from the meter to the battery, all energy data is gathered in one centre, monitored in real time and turned into action.

  • Modular Architecture

    Sector-Specific Smart Modules

    A modular architecture whose modules can be added or removed as needed — start with one and grow step by step.

  • Monitoring

    Real-Time Asset Monitoring

    Every device and asset in the field is monitored on one screen, with its live status.

  • Artificial Intelligence

    AI-Based Anomaly Detection

    Abnormal consumption, fault or leak patterns are detected automatically.

  • Action

    Alarm and Event Engine

    When critical thresholds are crossed, instant notification and field coordination are triggered.

  • Reporting

    Reporting and Dashboard

    Data from every module is reported on one panel and KPIs are calculated automatically.

  • Integration

    ERP / SCADA / REST API

    Two-way data flow with enterprise systems and field protocol connectivity.

Let's Begin

Let's build the digital layer of your energy together.

All ten modules work together on one platform — generation, consumption and storage meet on the same screen.