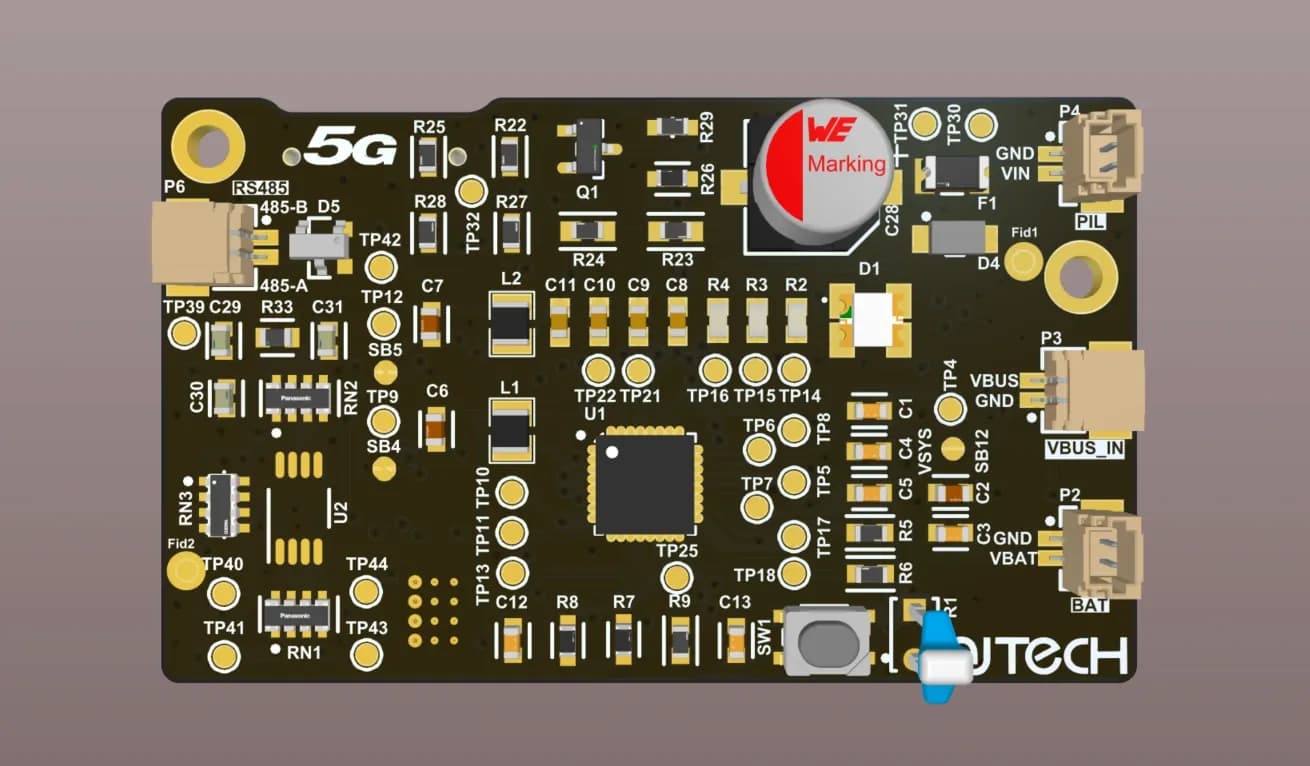
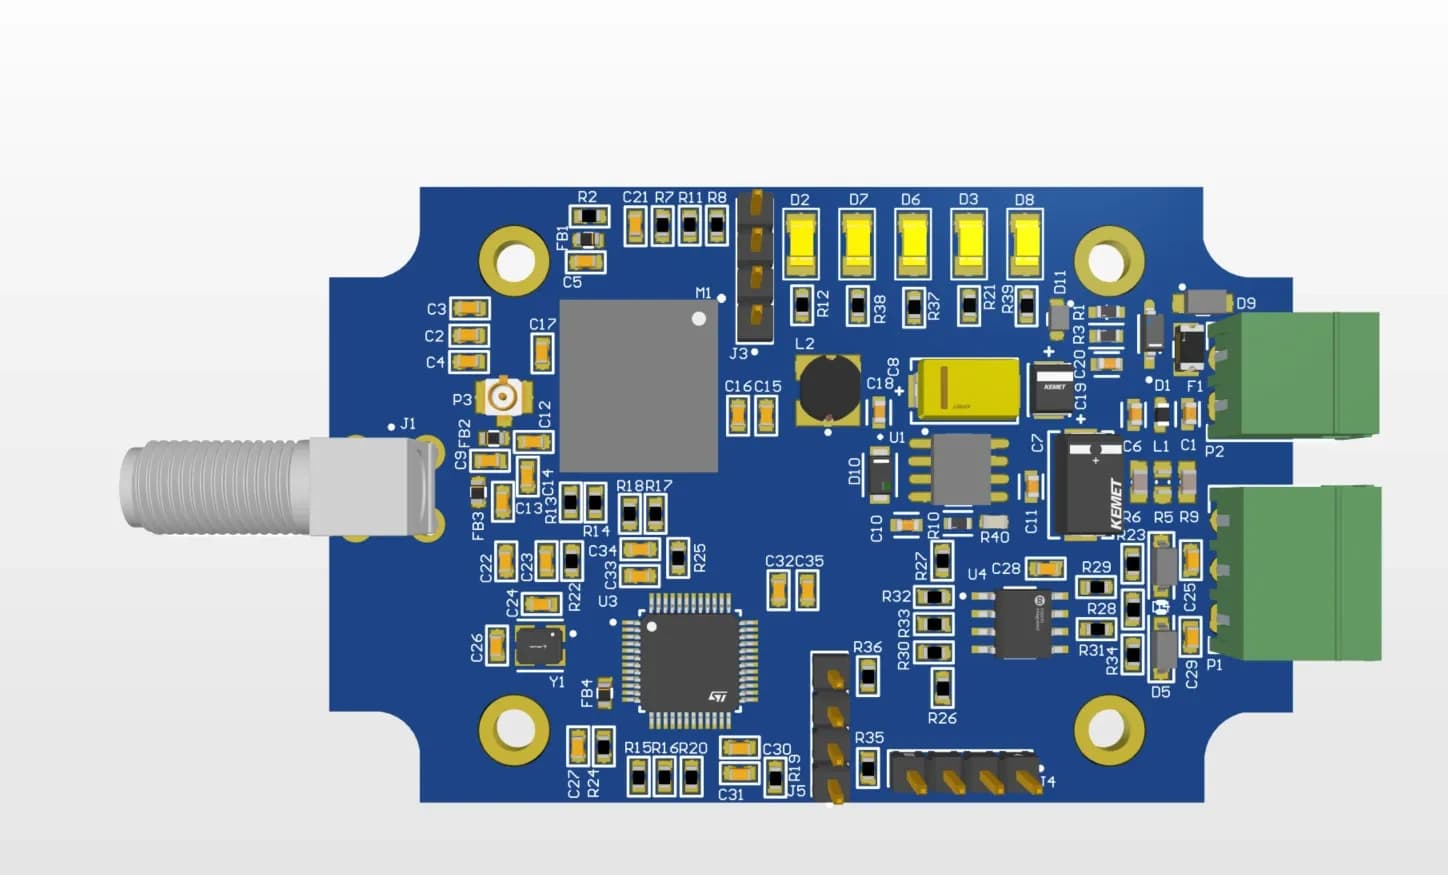

IoT Solution Ecosystem

Smart Facility Managementmanage every square metre of the building from one screen.

A facility's operational load usually builds up where nobody can see it. Nu Platform brings every sub-system of the building together in a single management layer, from lighting to HVAC and from the water line to critical room security, and makes the move to an NSEB-compliant operating model possible in concrete, measurable steps.

01 / 16

Smart Building Systems

Every sub-system of the building, on one platform.

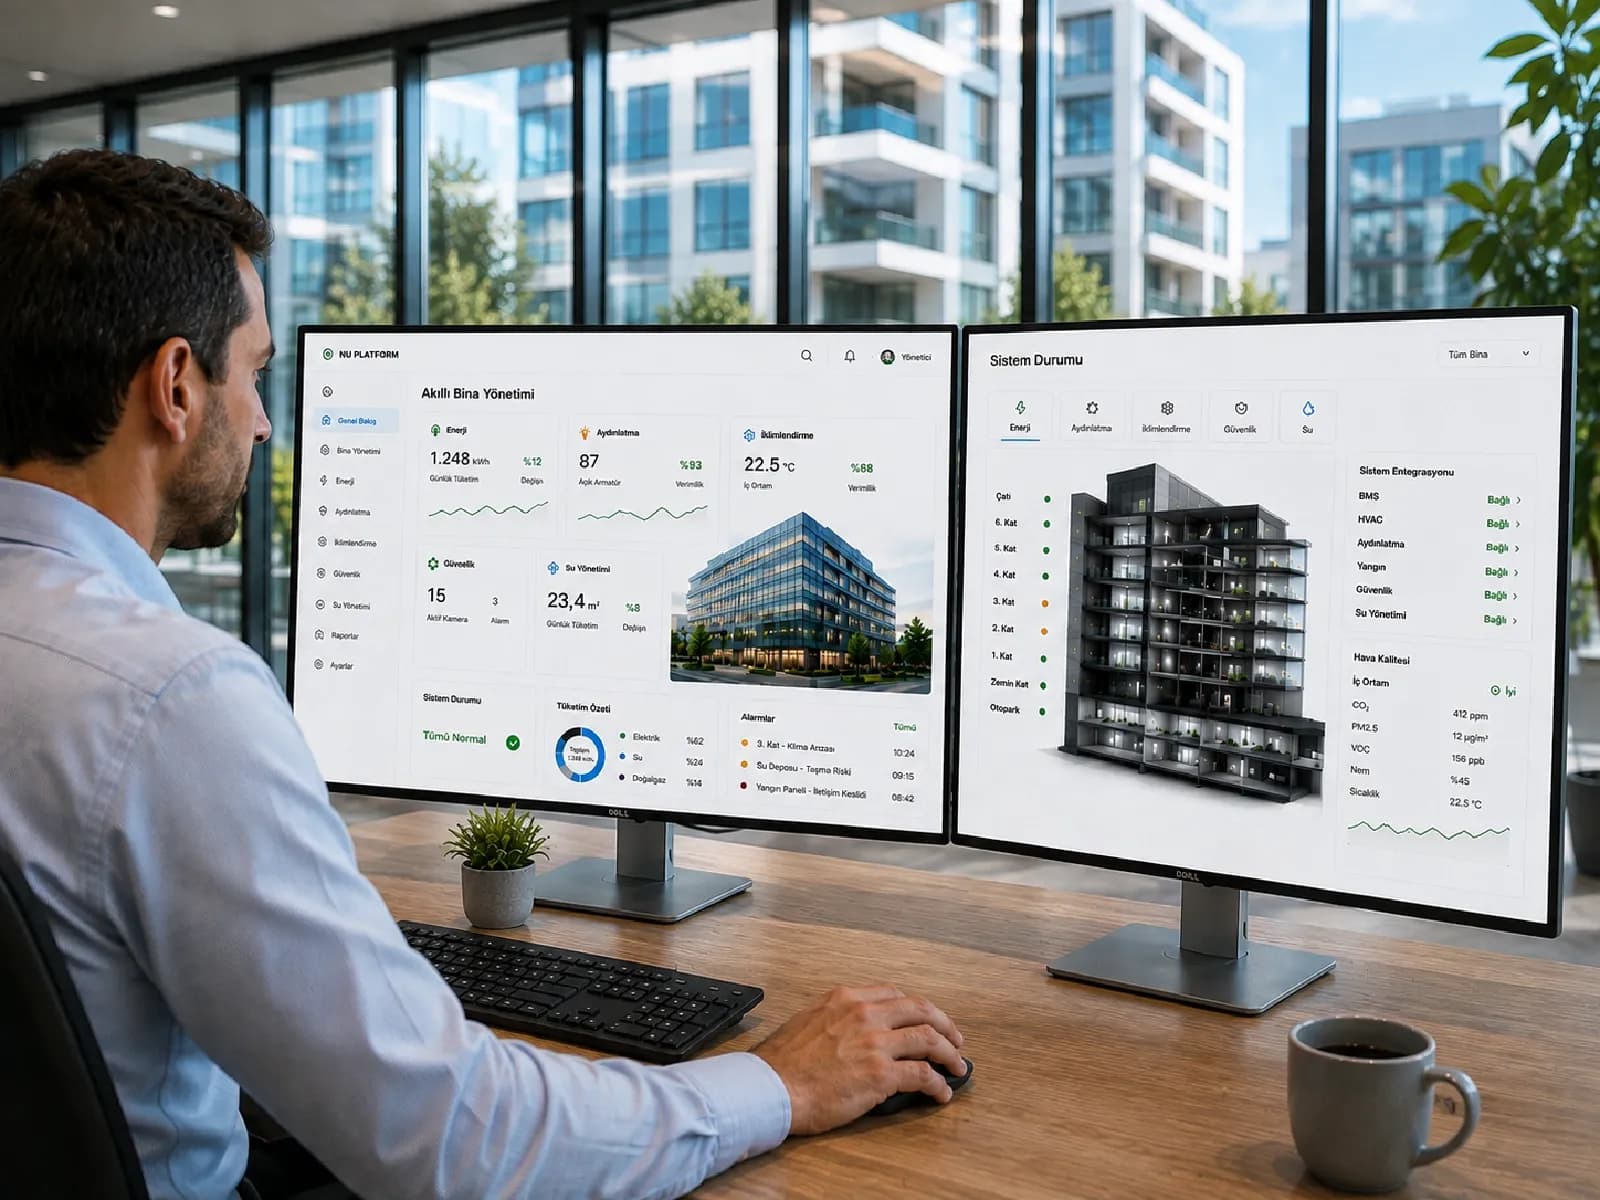
The core layer that brings every sub-system of a building (energy, lighting, HVAC, security, water) together on one platform. Each new module is added to the existing sensor and communication infrastructure — no installation from scratch is required.
  • Multiple systems from one platform
  • Modular expansion
  • Compatible with existing infrastructure
  • Energy, lighting, HVAC, security and water on one screen
  • Module-by-module commissioning and gradual expansion
  • Integration with existing sensor and communication infrastructure
Smart Building Systems — Building Automation
02 / 16

Smart Home Application

Keep a finger on the system's pulse without being on site.

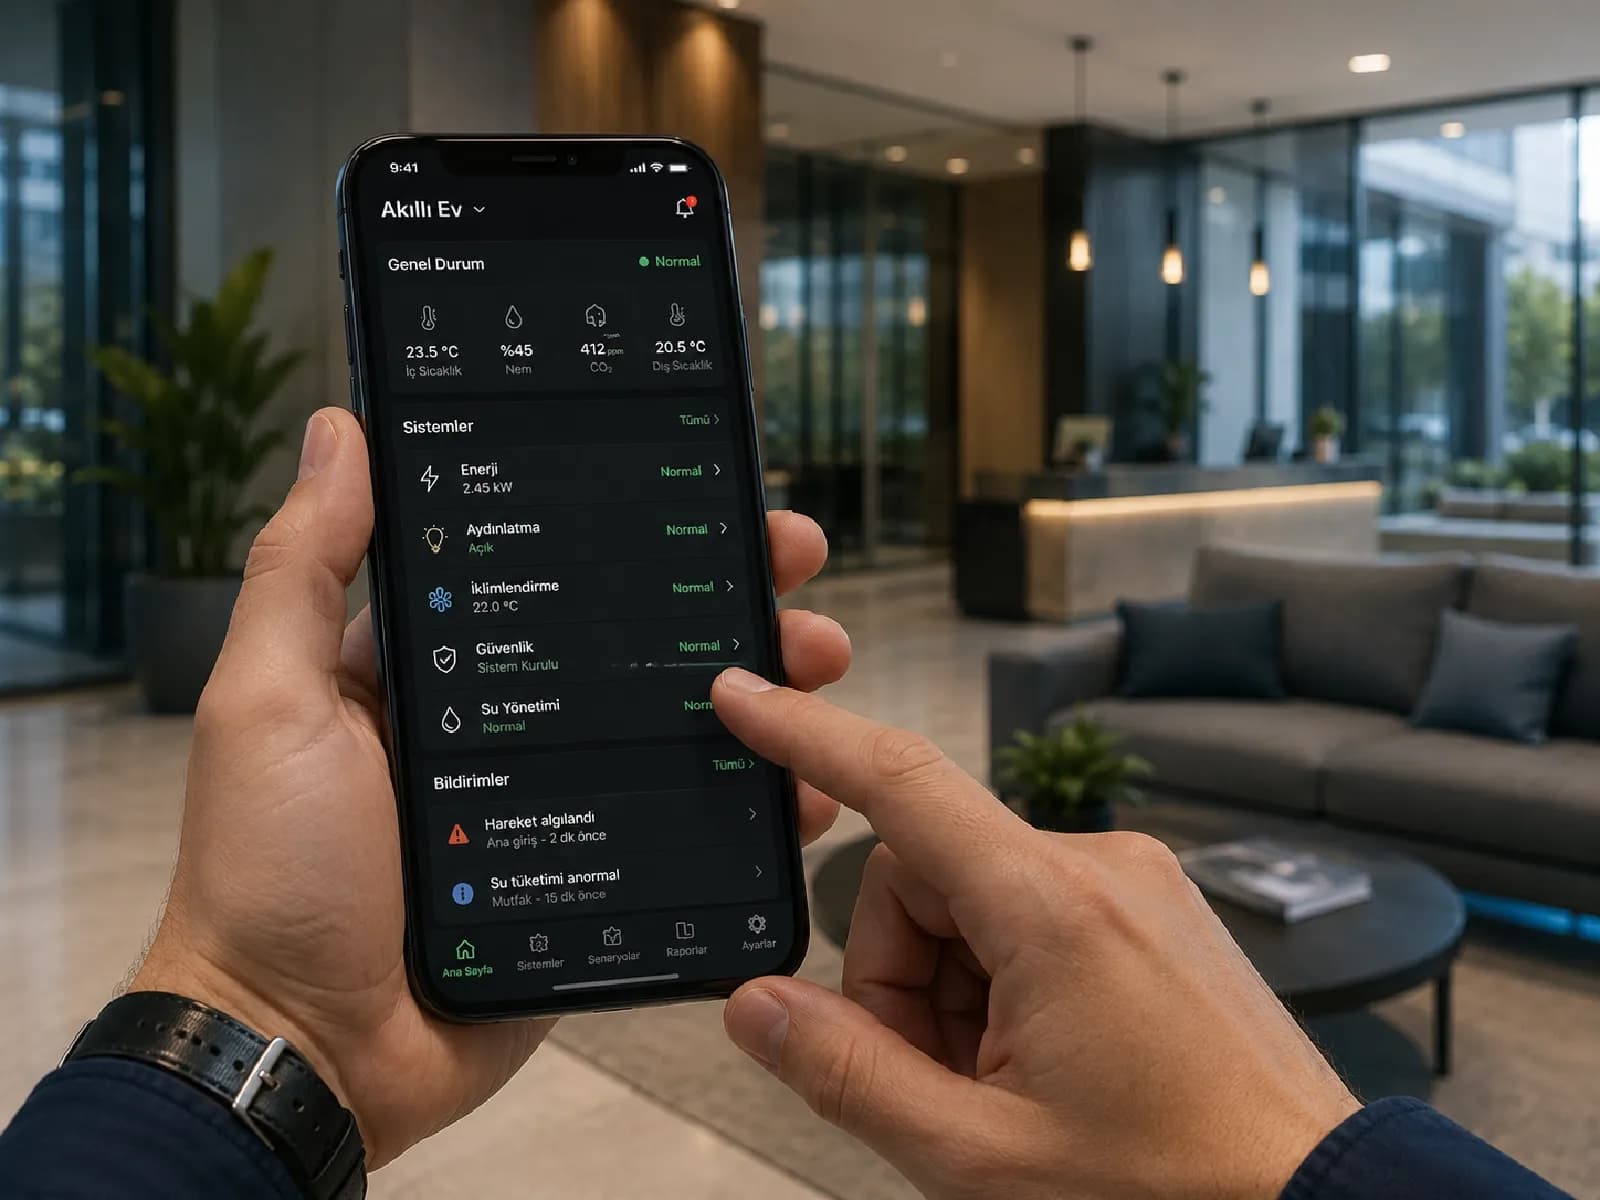
Live monitoring and management of building and facility data through a mobile application, so a decision-maker can keep a finger on the system's pulse without being on site.

  • Live mobile access
  • Remote management
  • Notification and alarm tracking
  • Live status monitoring from a mobile application
  • Remote control and scenario management
  • Instant notification and alarm integration
Smart Home Application — Mobile Application
03 / 16

Energy Management and Meter Automation

Bill every unit separately, and fairly.

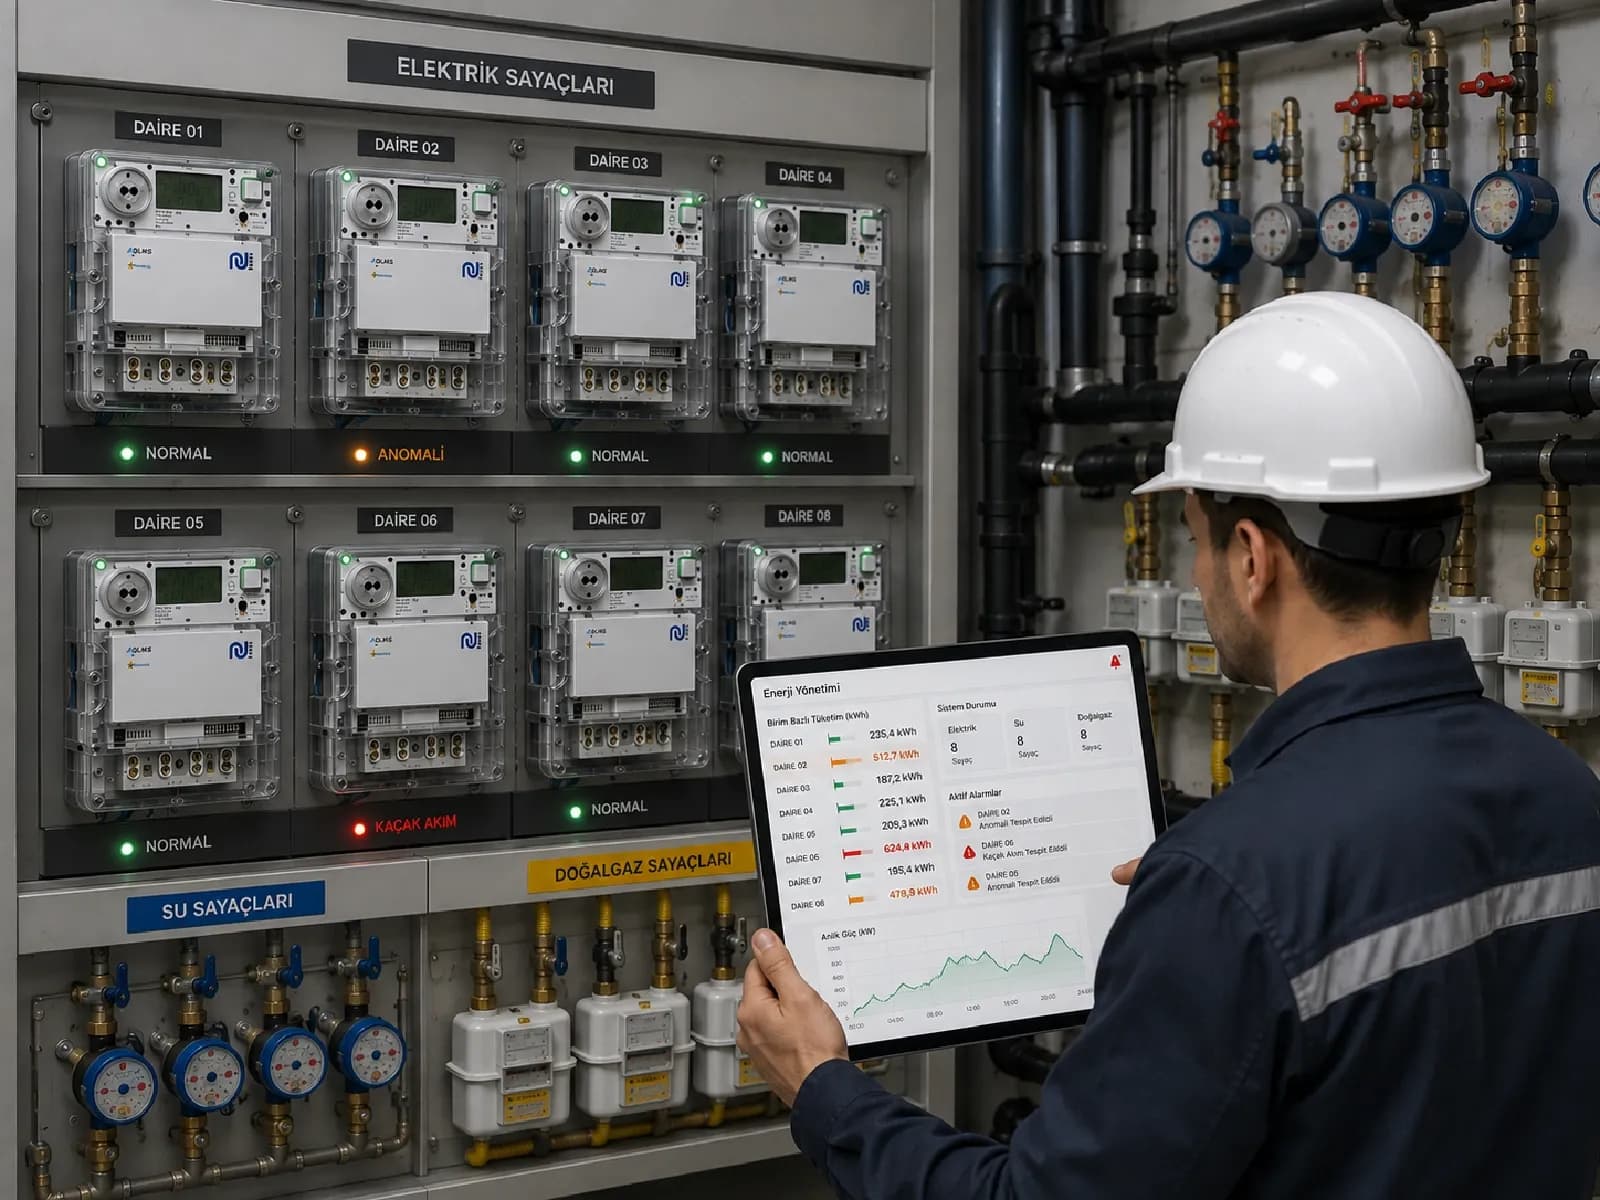
Every electricity, water and natural gas meter in the building is monitored live through IoT-based modules. Separate consumption reports per unit or tenant make fair billing possible; monitoring parameters such as reactive power, harmonics and leakage current avoids penalty charges.

  • Fair billing per unit
  • Penalty risk removed
  • NSEB-compatible consumption profile
  • IoT-based monitoring of electricity, water and natural gas meters
  • Separate consumption reporting per unit
  • Reactive power, harmonic and leakage current monitoring

12%

Example energy saving from running HVAC against the demand curve

Technical Note

Running the HVAC system against the energy demand curve using live data delivered energy savings of up to 12% in one example deployment.

Energy Management and Meter Automation — Meter Automation
04 / 16

Remote Meter Monitoring

Catch a leak within hours, without going to the field.

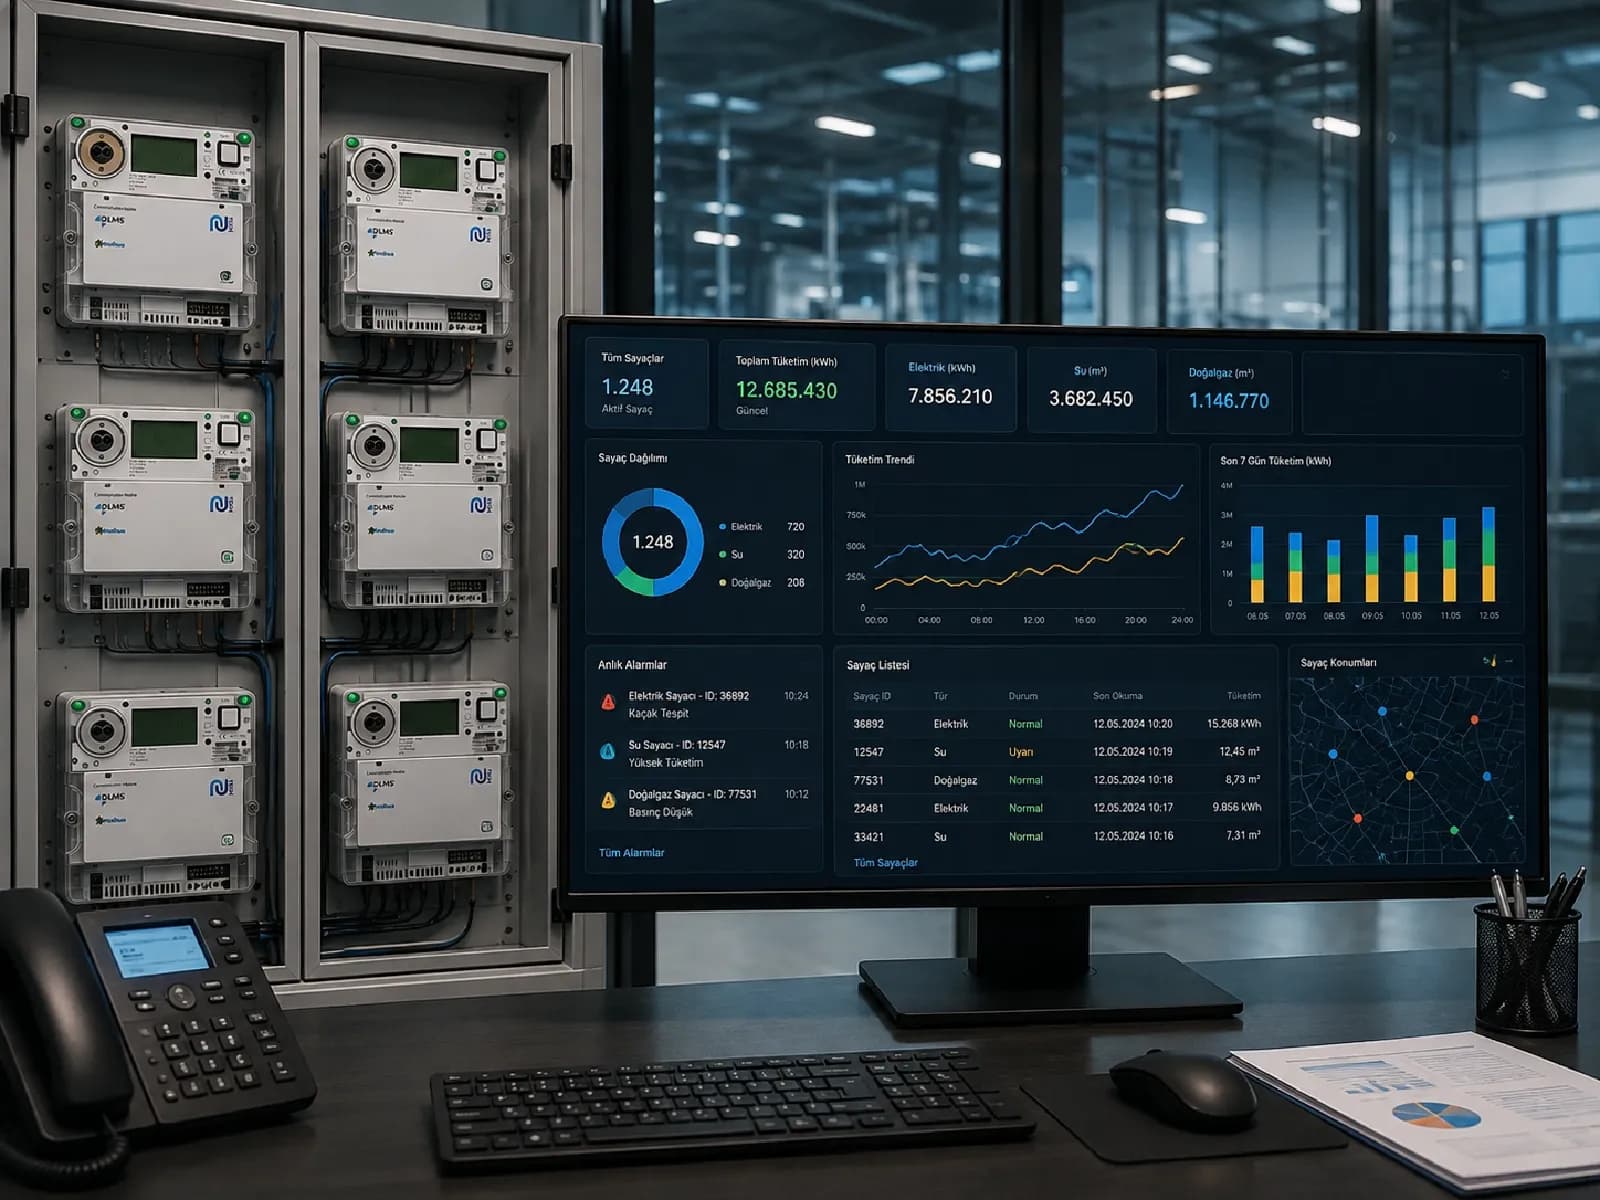
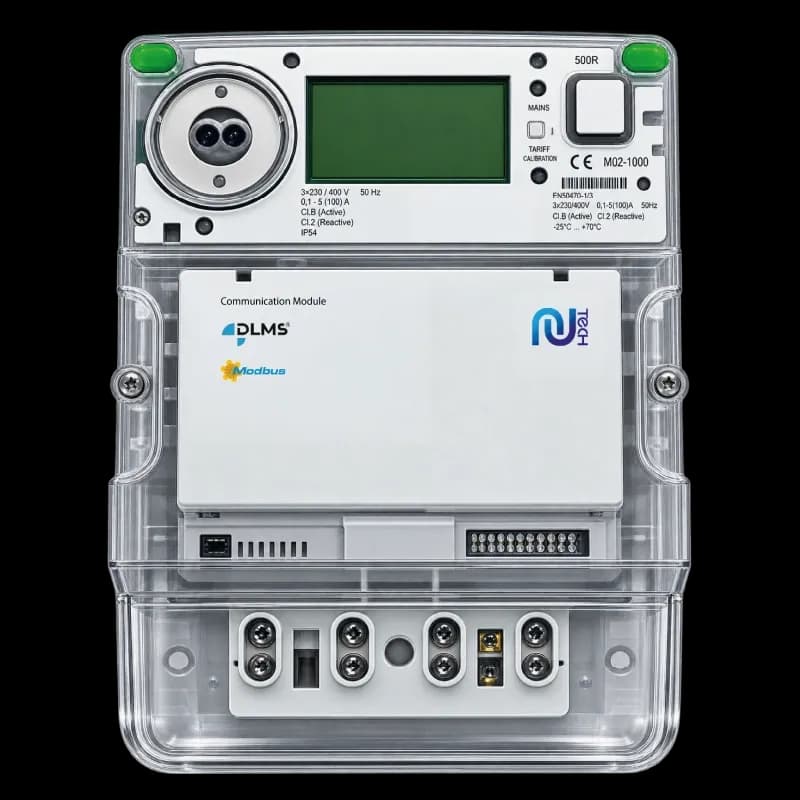
Reading electricity, water and gas meters automatically, without visiting the field; it removes human error, produces accurate billing and detects loss and theft immediately.

  • Leak detection from days to hours
  • Field staffing cost removed
  • Accurate billing
  • Remote reading of electricity, water and natural gas meters
  • Live monitoring and reporting on the central platform
  • Instant alarm and alert system

loss %

Loss-and-theft rate and reading accuracy become measurable

Remote Meter Monitoring — Meter Module
05 / 16

Lighting Management

Every luminaire, on exactly when it is needed.

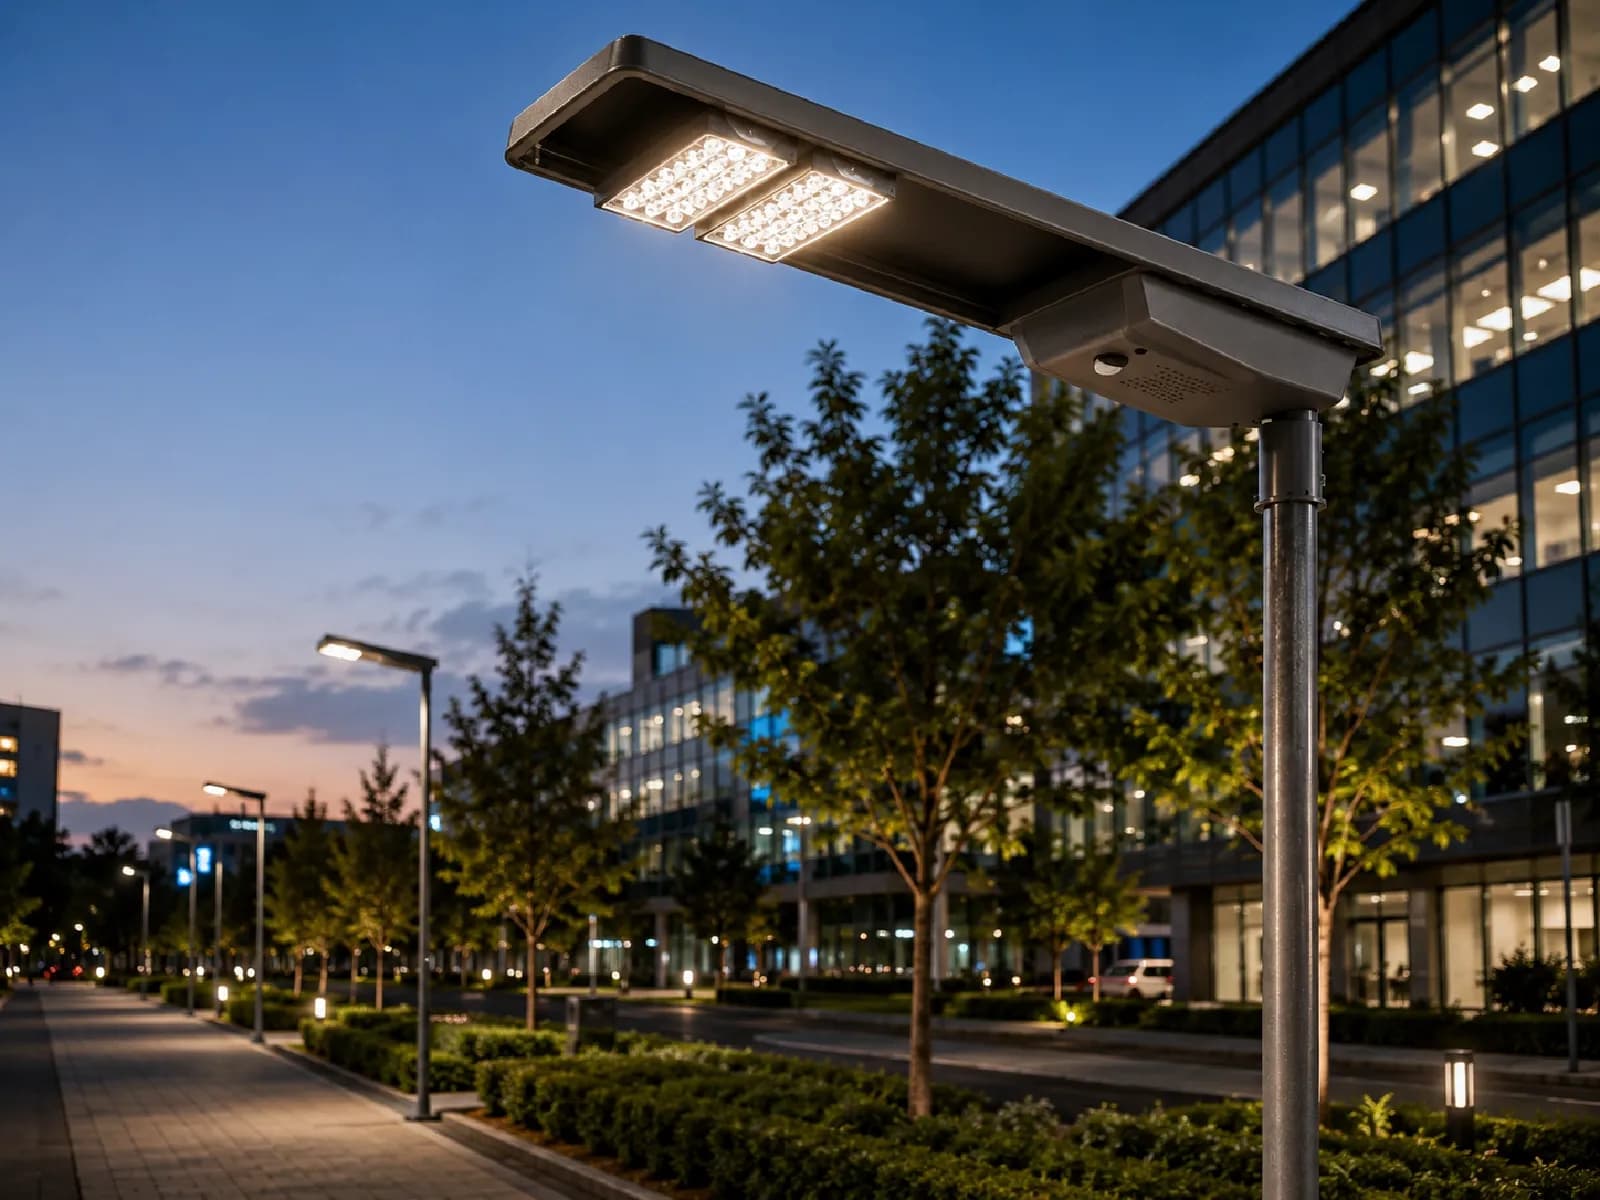
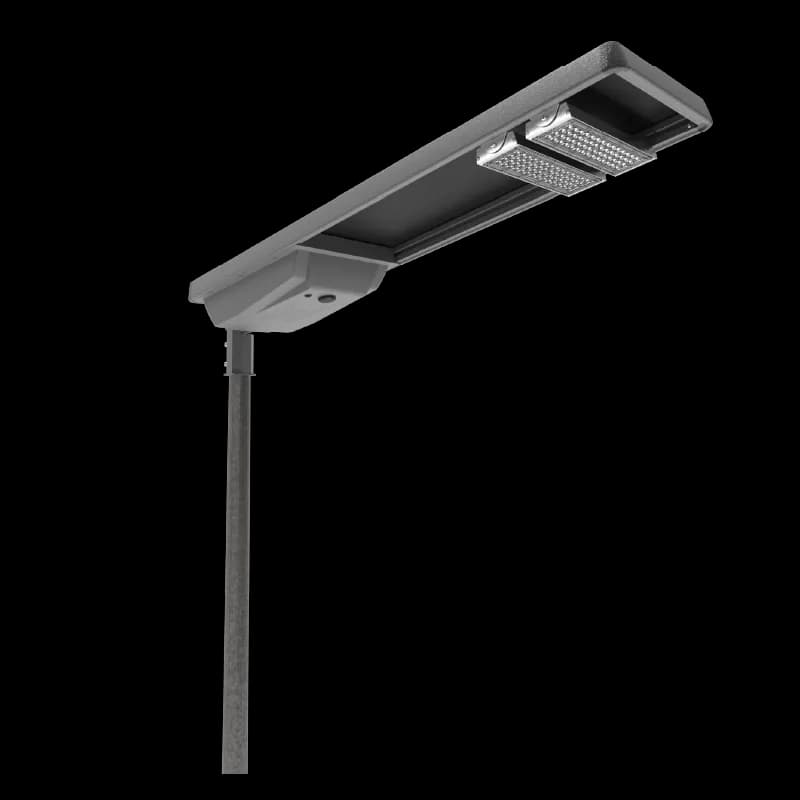
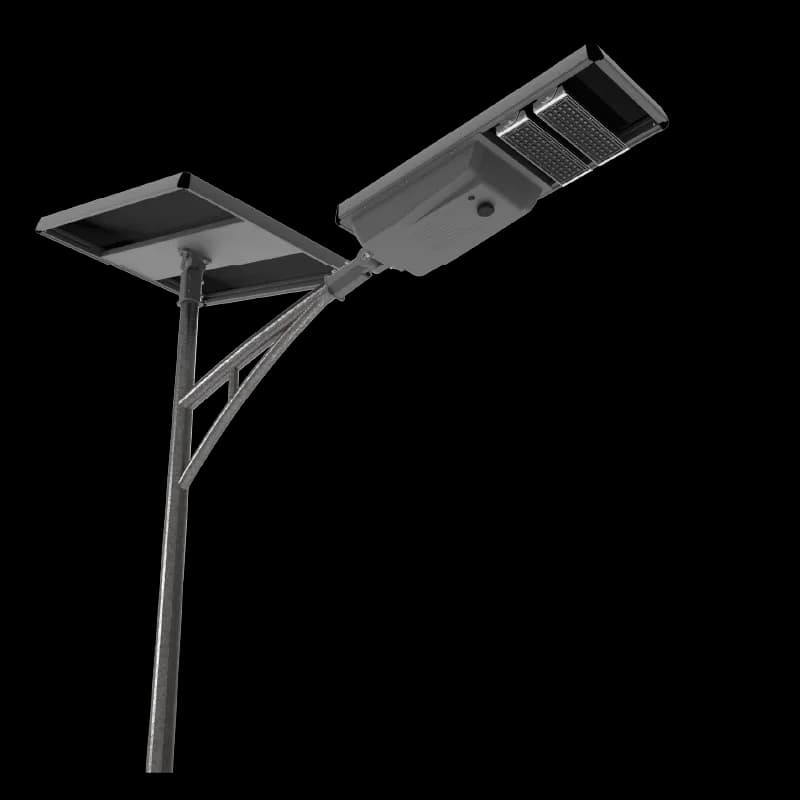
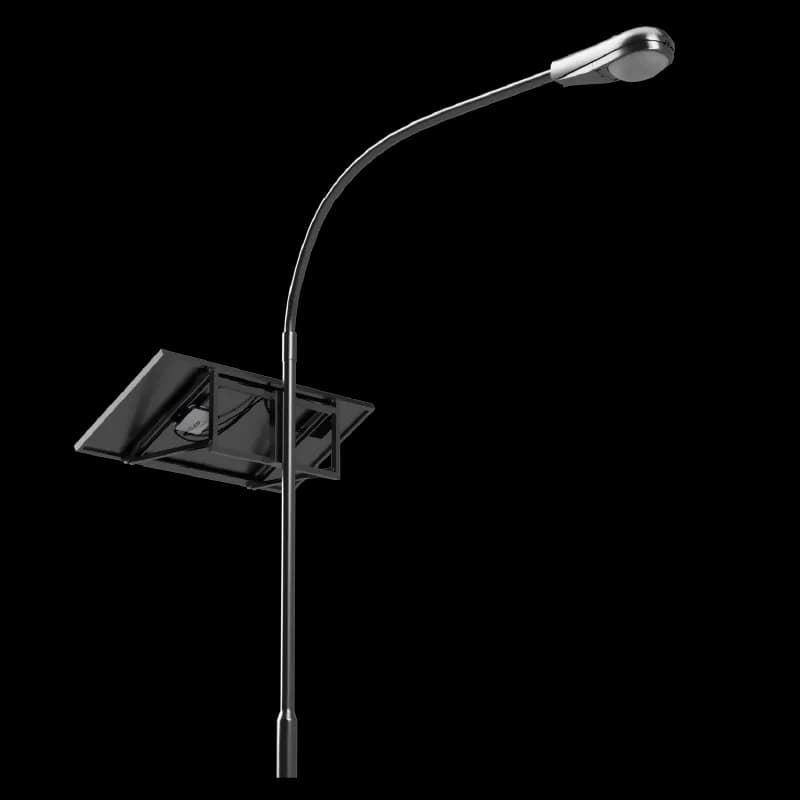
On the AC line, Zhaga-socket LED luminaires come on through motion and ambient-light sensors exactly when they are needed; on the DC line, Solar LED systems run independently of the grid at zero energy cost.

  • 30-50% energy saving
  • 60% faster fault response
  • Remote management
  • AC lighting with motion and ambient light sensors
  • Grid-independent Solar LED (DC) systems
  • Remote monitoring, control and automatic fault detection

40%

Energy saving with Solar LED, and grid-independent operation

Lighting Management — Smart Luminaire
06 / 16

Emergency Equipment Monitoring

See the fault without waiting for inspection day.

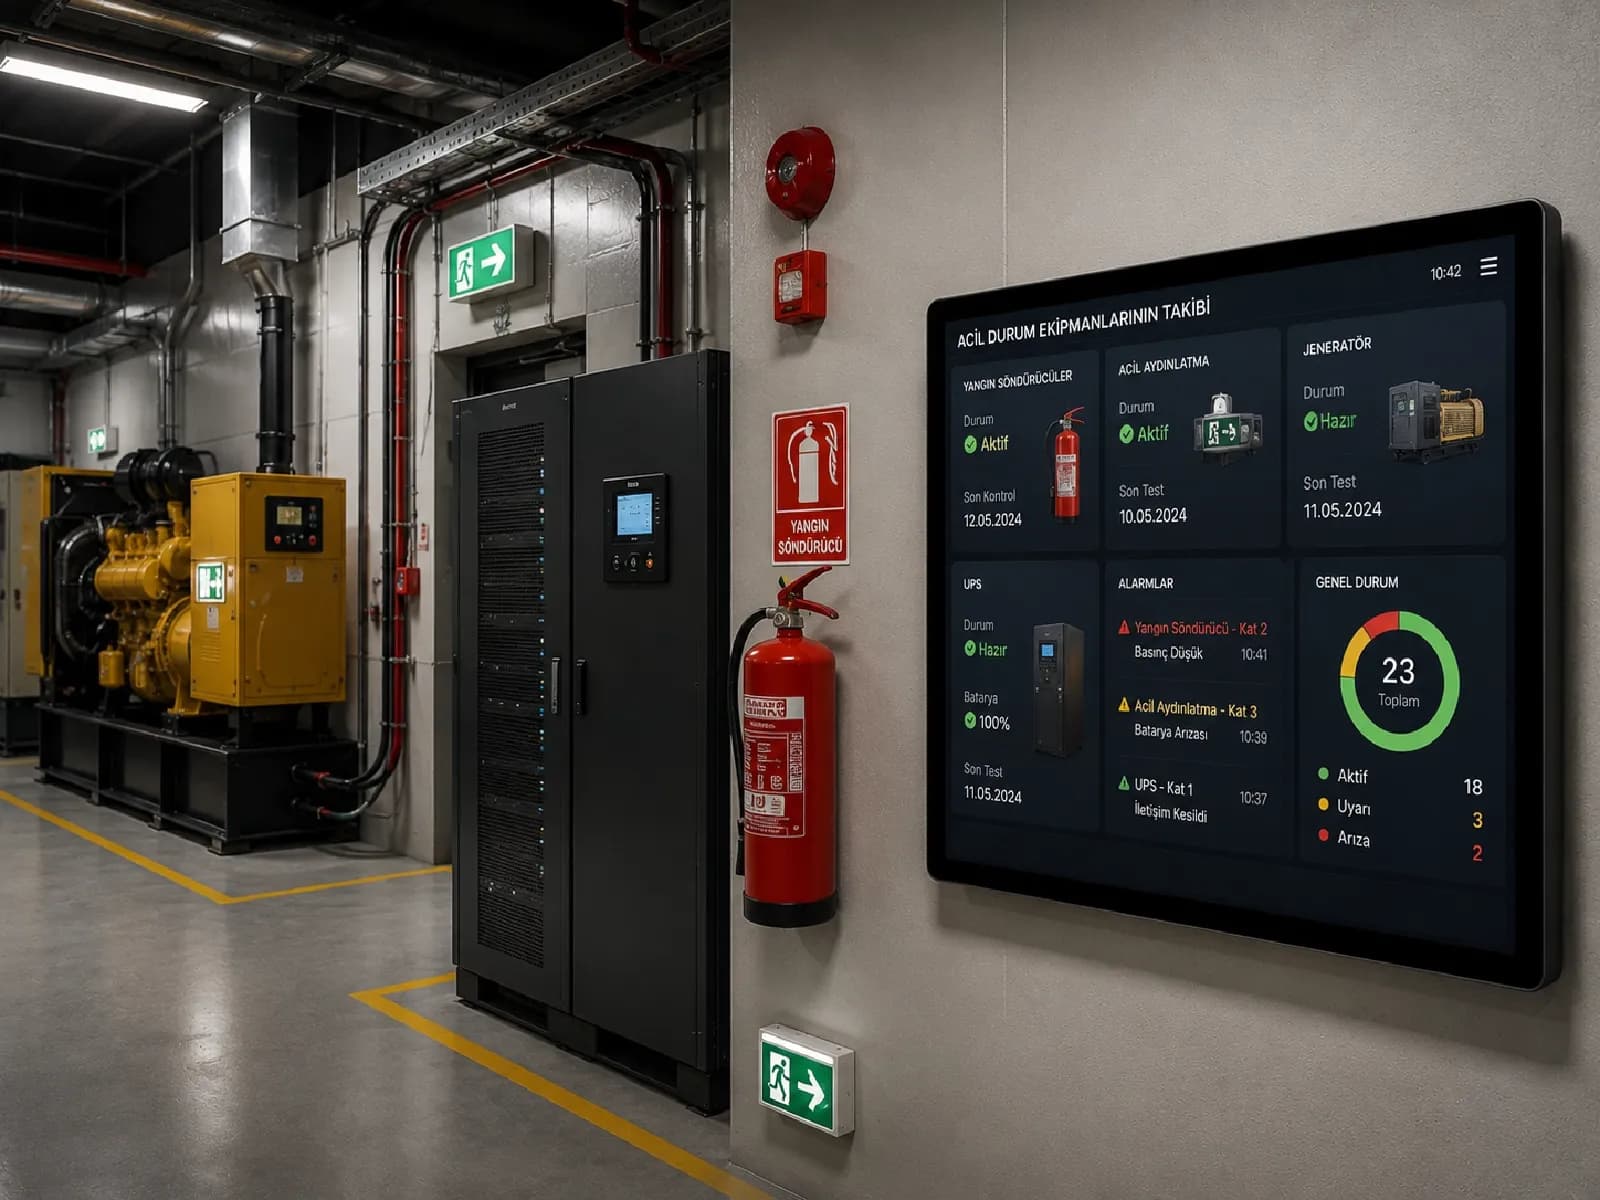
Continuous monitoring of the condition of critical safety equipment such as fire extinguishers, emergency lighting, generators and UPS units; a fault or a missing item becomes visible through an instant notification rather than waiting for an inspection.

  • Continuous condition monitoring
  • Instant fault notification
  • Visibility before inspection
  • Fire extinguisher and emergency lighting condition monitoring
  • Generator and UPS readiness monitoring
  • Instant notification of a missing item or a fault
Emergency Equipment Monitoring — Critical Equipment Monitoring
07 / 16

Landscape Area Management

If rain is coming, there is no need to irrigate.

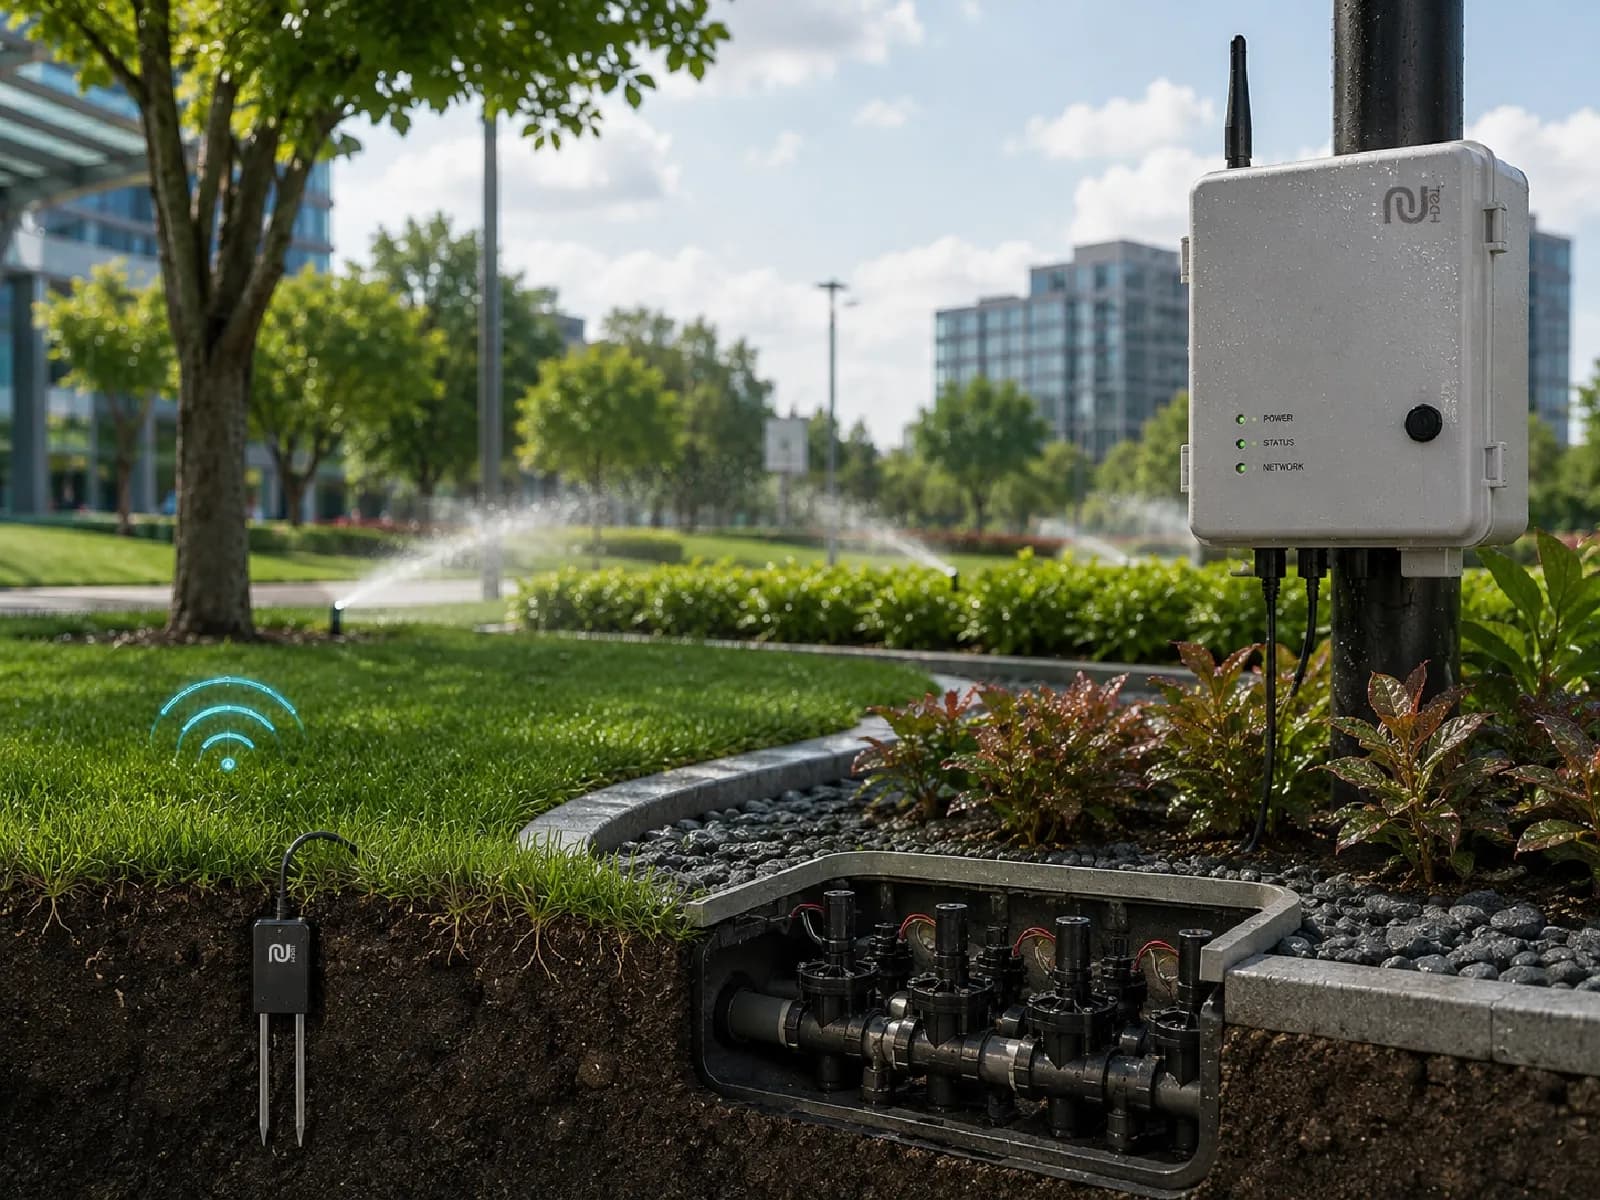
A smart irrigation system that combines soil moisture sensors with live weather data; it prevents unnecessary irrigation, saves water and keeps landscape quality high while lowering maintenance cost.

  • 30-40% water saving
  • Automatic valve control
  • Rainfall forecast integration
  • Live data from soil moisture sensors
  • Automatic opening and closing of irrigation valves
  • Cancellation of unnecessary irrigation using rainfall forecasts

30-40%

Reduction in water consumption, and a direct cost saving

Landscape Area Management — Irrigation Sensor
08 / 16

HVAC Management

Balance comfort and energy consumption on the same screen.

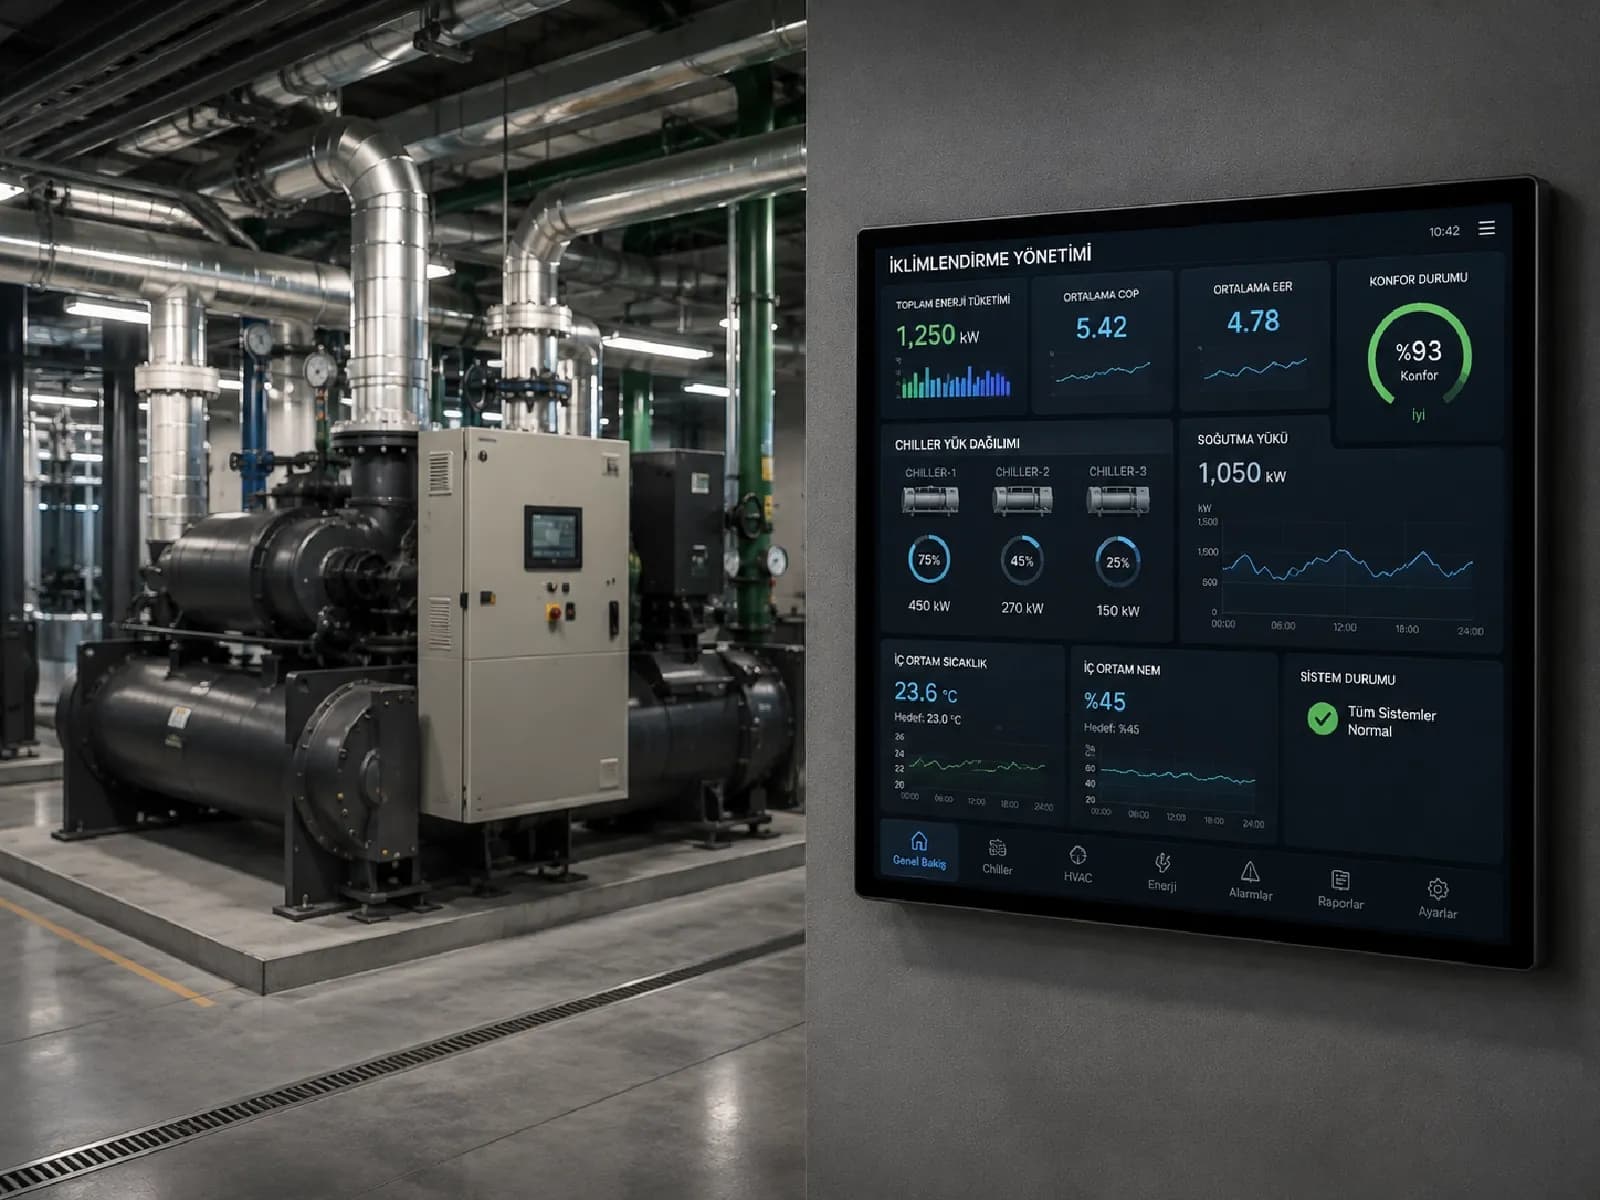
By comparing the energy chiller and HVAC systems consume with the comfort they deliver, the optimum operating point is identified; COP/EER tracking exposes inefficient operating conditions.

  • Cooling load balancing
  • COP/EER tracking
  • Critical temperature stability
  • Chiller cooling load balancing
  • COP/EER based inefficiency detection
  • Comparison of HVAC energy consumption against comfort
HVAC Management — HVAC Controller
09 / 16

Air Quality Monitoring

Let visitor comfort be a measurable figure.

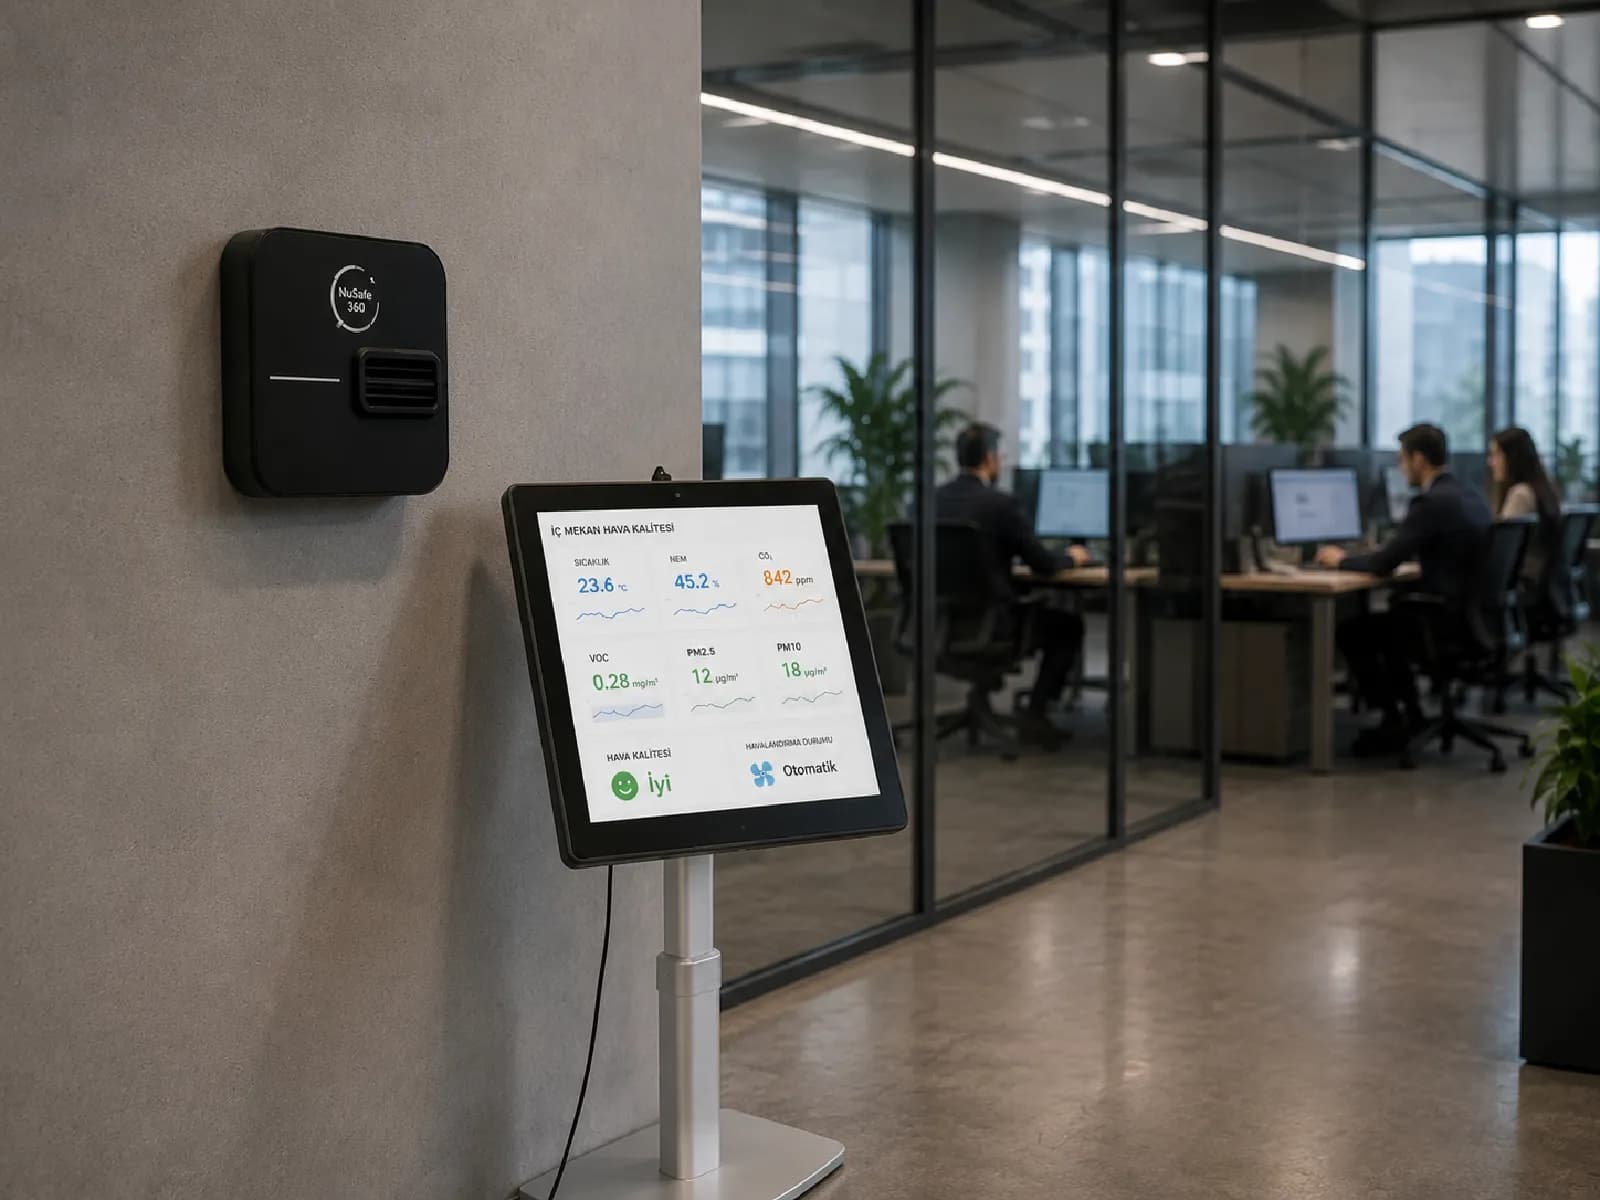
Indoor quality is measured and reported continuously through temperature, humidity, CO2, VOC and particulate (PM2.5/PM10) sensors; the sensor data works with the building automation system so ventilation is engaged only when it is needed.

  • Continuous IAQ monitoring
  • Automatic ventilation trigger
  • Comfort and health data
  • Temperature, humidity, CO2, VOC and PM2.5/PM10 monitoring
  • Automatic integration with HVAC
  • Instant alarm in the event of a deviation

Technical Note

When CO2 levels rise during busy hours the system increases the fresh air ratio automatically, returning to its minimum level as occupancy falls.

Air Quality Monitoring — IAQ Sensor
10 / 16

Water Leak and Flow Anomaly Detection

See the leak on a screen, not behind the wall.

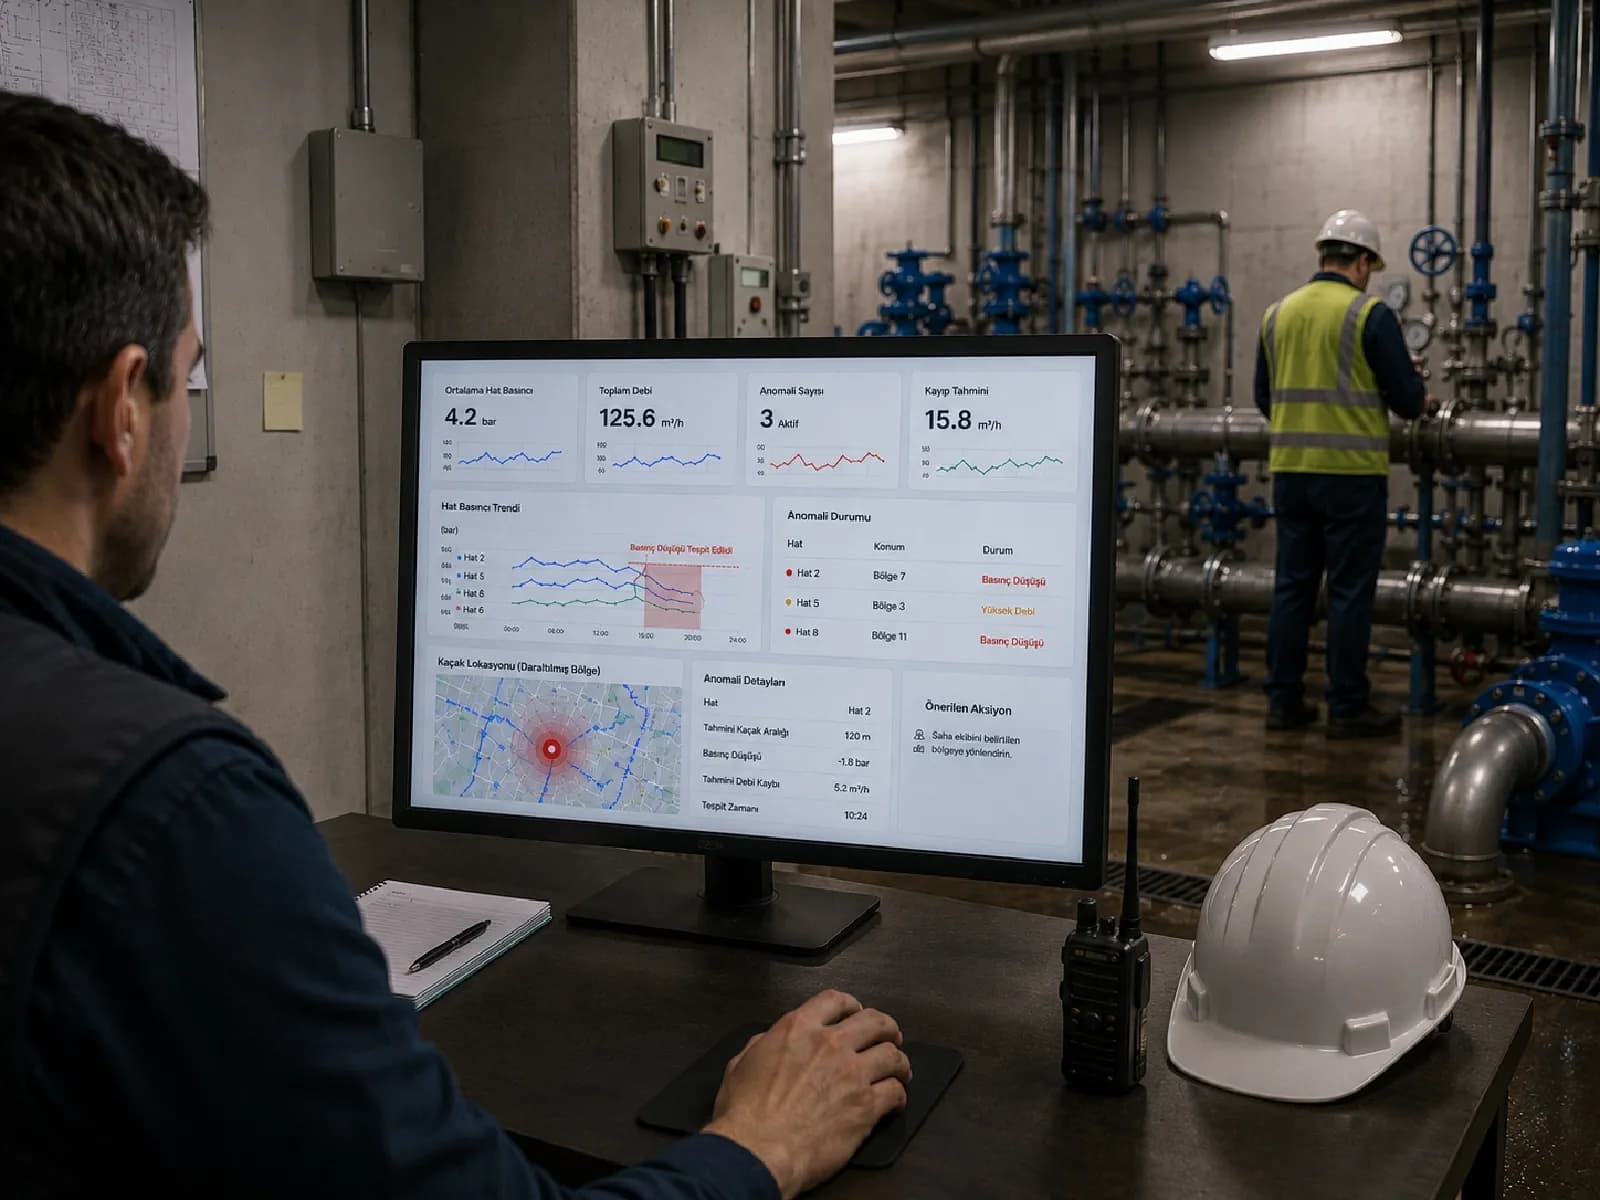
Pressure drops in the pipe network are detected automatically; the leak location is narrowed down so the field team is directed to the right point.

  • 15-30% loss reduction
  • Automatic pressure detection
  • Fast response
  • Line pressure and flow anomaly monitoring
  • Automatic narrowing of the leak location
  • Directing the field team to the right point

15-30%

Measurable reduction in the water loss rate

Water Leak and Flow Anomaly Detection — Pressure Sensor
11 / 16

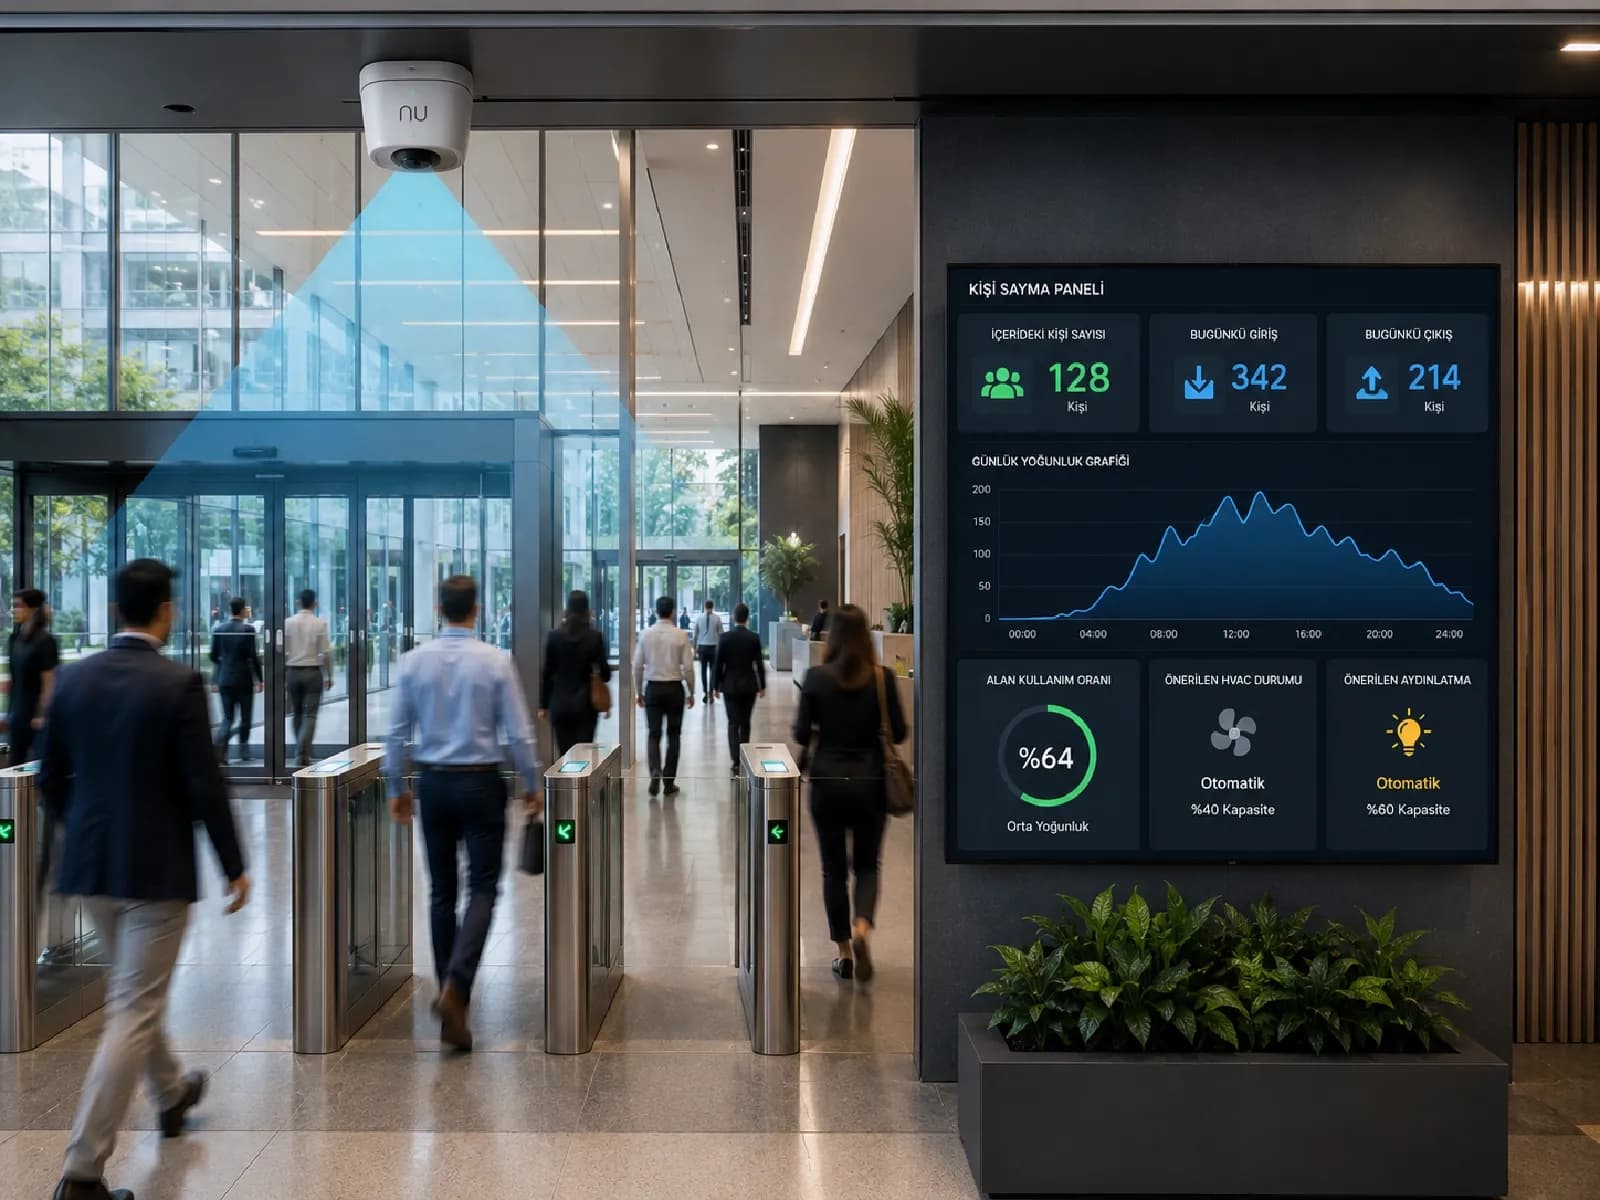
People Counting

Let data, not guesswork, decide how space is used.

Occupancy data at entry and exit points provides real-time input for space utilisation, shift planning and energy and HVAC optimisation.

  • Real-time occupancy data
  • Shift planning input
  • HVAC optimisation input
  • Occupancy counting at entry and exit points
  • Data support for shift and staff planning
  • Input to HVAC and lighting optimisation
People Counting — Occupancy Sensor
12 / 16

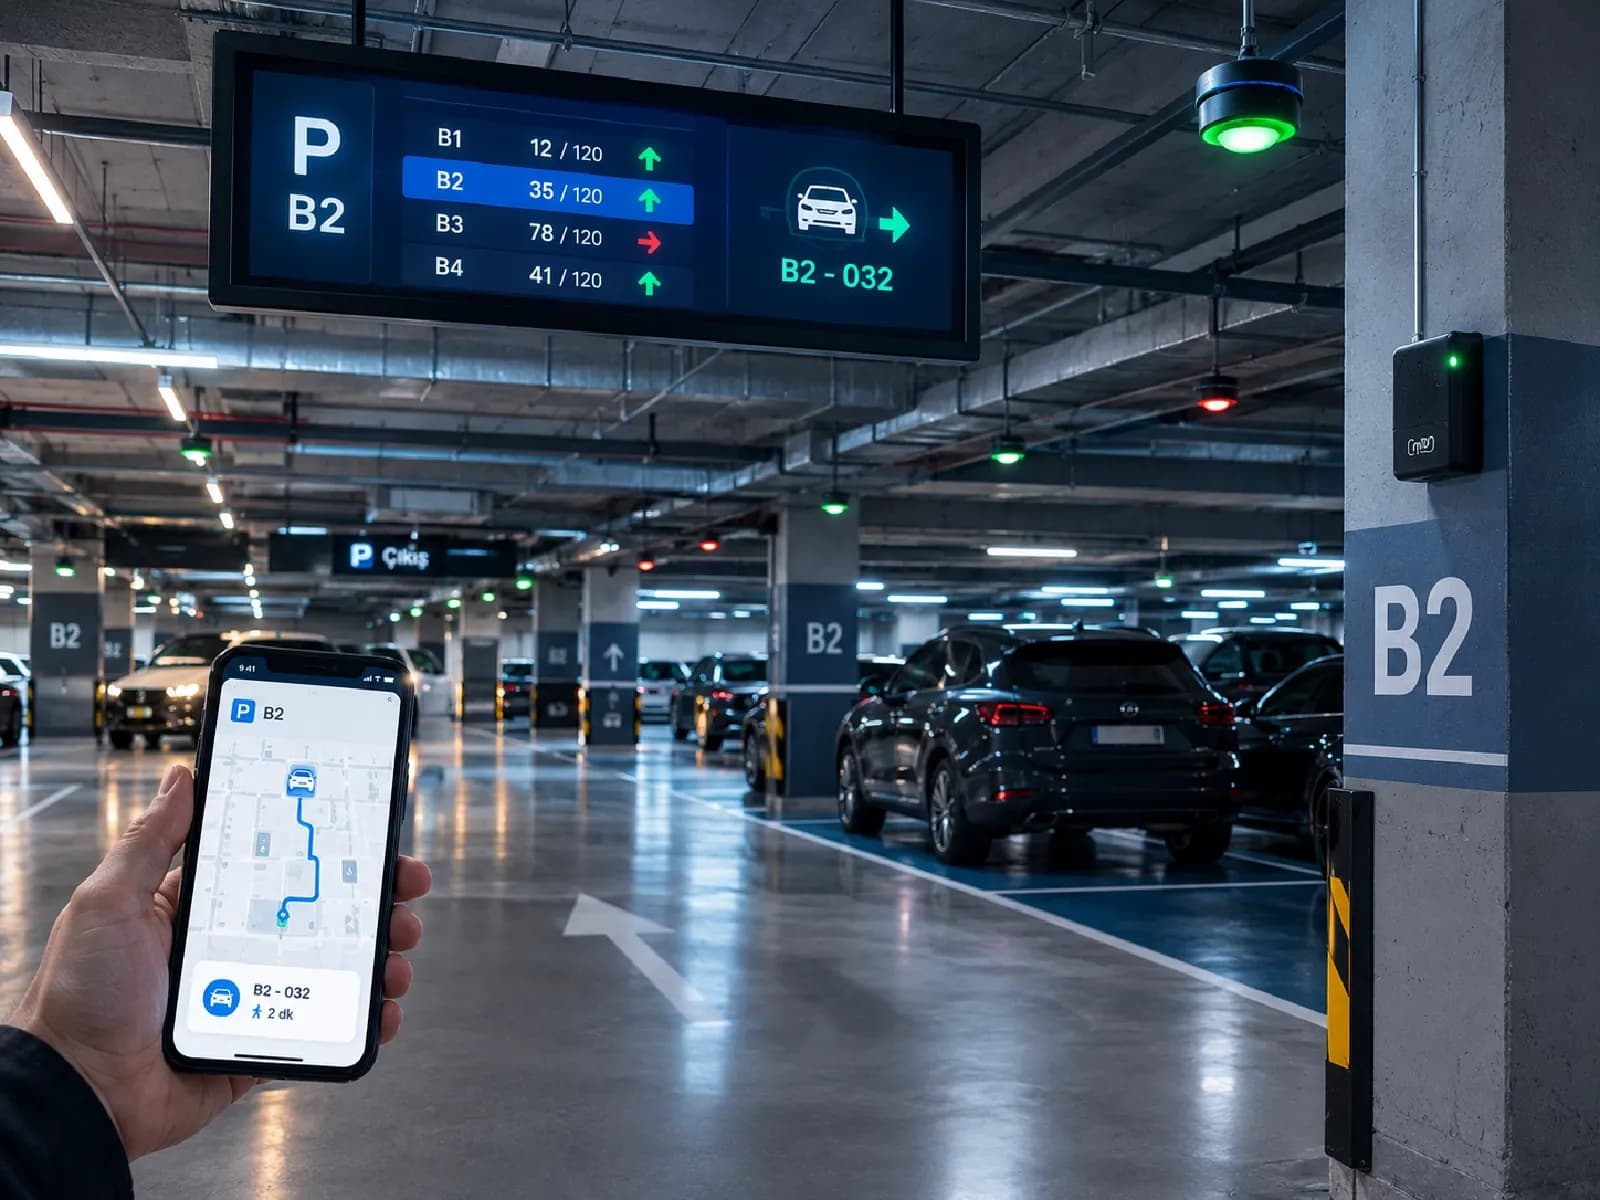
Smart Parking Management

End the search for a space on a digital display.

Vehicle counting and floor-level occupancy analysis drive dynamic guidance; showing the number of free spaces on digital displays shortens the search for a space. Ventilation and lighting are optimised automatically according to occupancy data.

  • Dynamic guidance
  • Energy saving tied to occupancy
  • Shorter parking search time
  • Vehicle counting and floor-level occupancy analysis
  • Dynamic guidance through digital displays
  • Automatic ventilation and lighting based on occupancy

~20 t

Example annual CO2 emission reduction from a shorter parking search

Technical Note

In one example deployment, reducing the parking search time from five minutes to two prevented roughly 20 tonnes of CO2 emissions a year.

Smart Parking Management — ANPR Camera
13 / 16

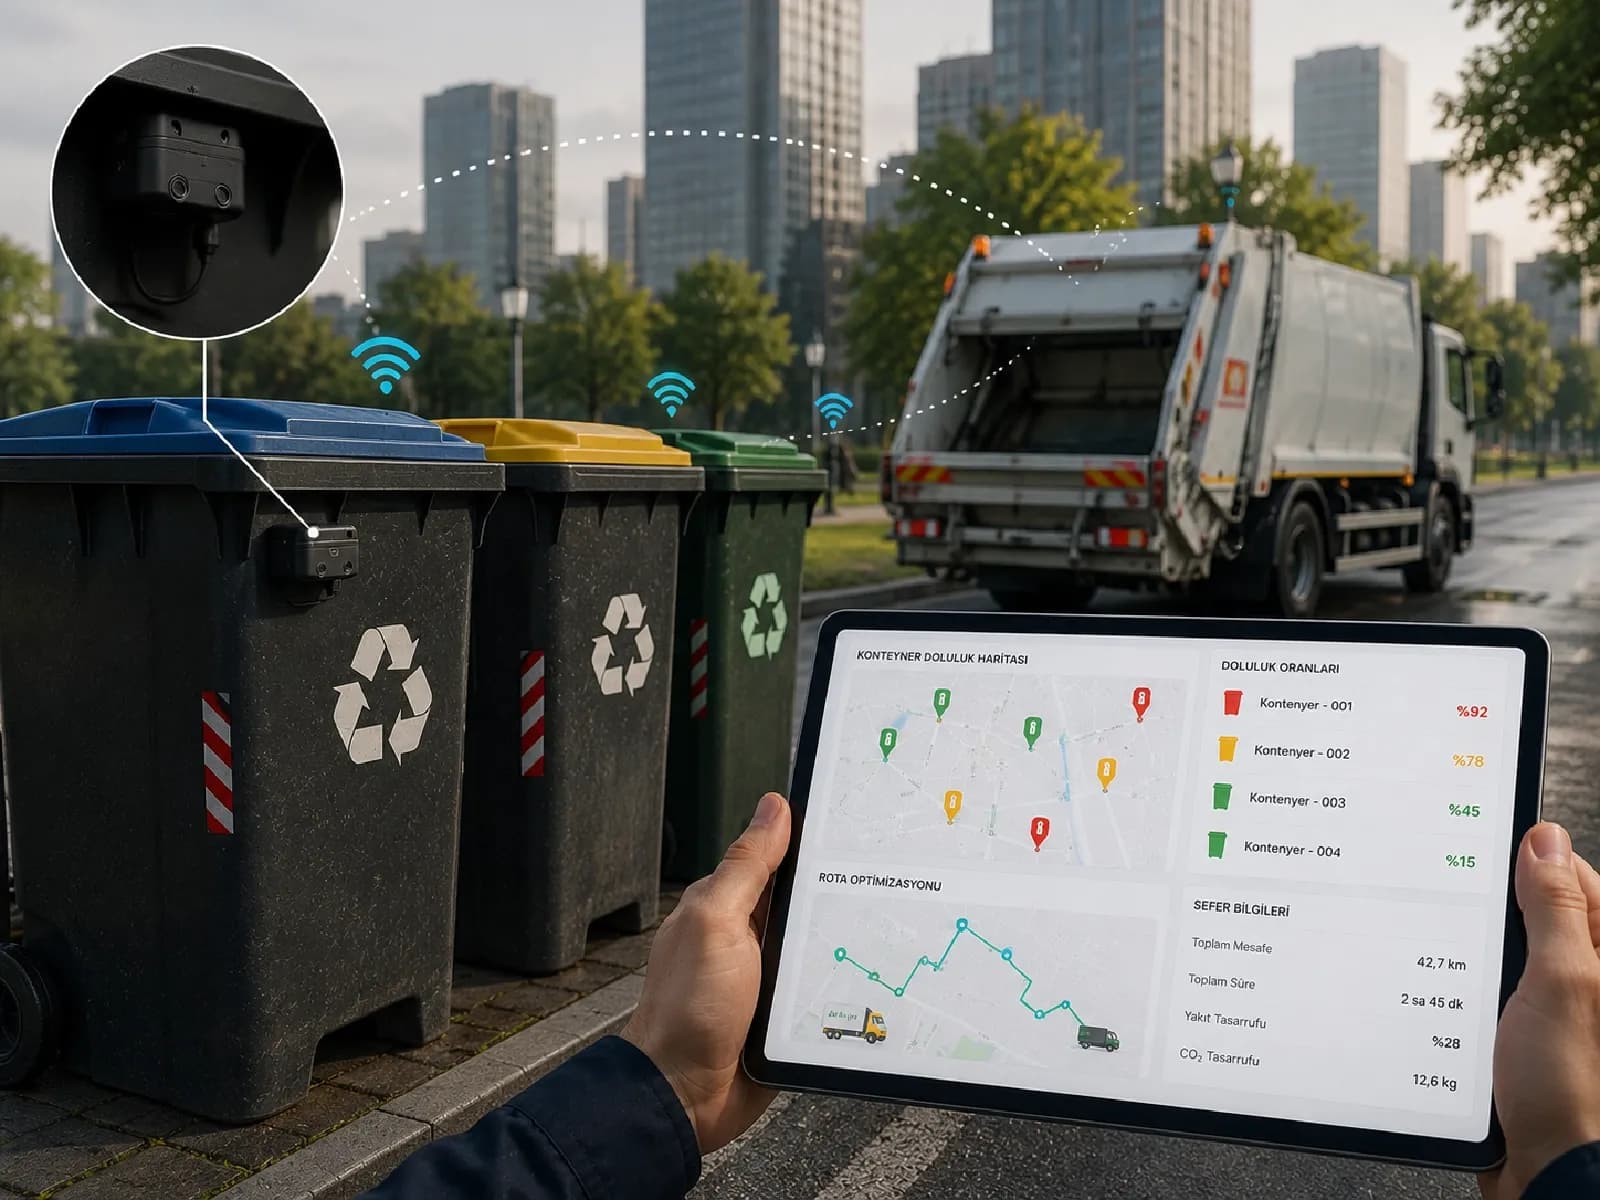
Waste Management

Send collection trips to full containers, not empty ones.

With container fill-level sensors and route optimisation, collection is directed only to full points; unnecessary trips, fuel and staffing cost fall.

  • 25-35% fuel saving
  • Fewer unnecessary trips
  • Sustainability contribution
  • Live fill level from an ultrasonic sensor
  • Dynamic route optimisation
  • Automatic alert at the critical threshold

25-35%

Fuel saving through route optimisation

Waste Management — Fill-Level Sensor
14 / 16

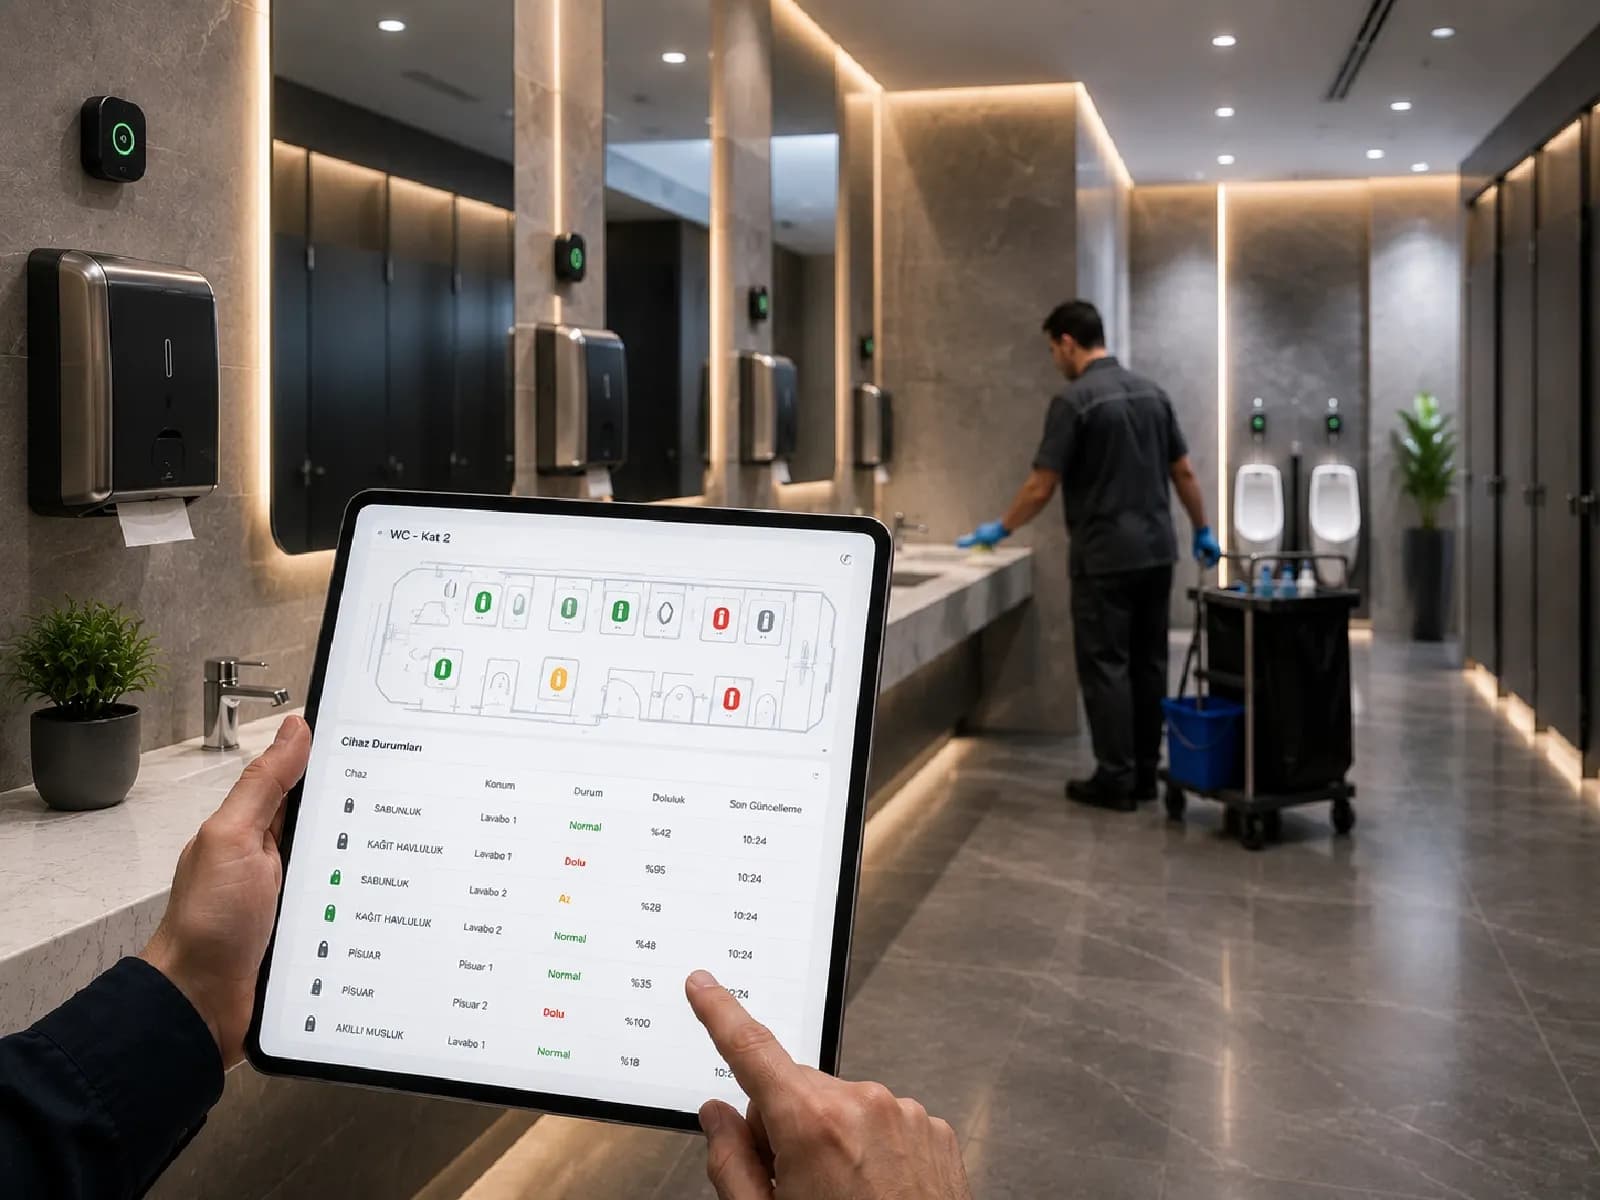
Washroom and Cleaning Consumables Monitoring

Direct the cleaning team by occupancy, not by assumption.

Fill level and fault information for taps, soap dispensers, paper towel dispensers and urinals is monitored in real time; cleaning teams are directed at the right moment based on occupancy and usage data.

  • 15-20% water saving
  • Cleaning at the right time
  • Smaller water footprint
  • Fill level and fault monitoring for taps, soap and paper towel dispensers
  • Directing the cleaning team from usage data
  • Water saving through smart taps

15-20%

Water saving through smart taps and sensor-equipped systems

Washroom and Cleaning Consumables Monitoring — Consumables Sensor
15 / 16

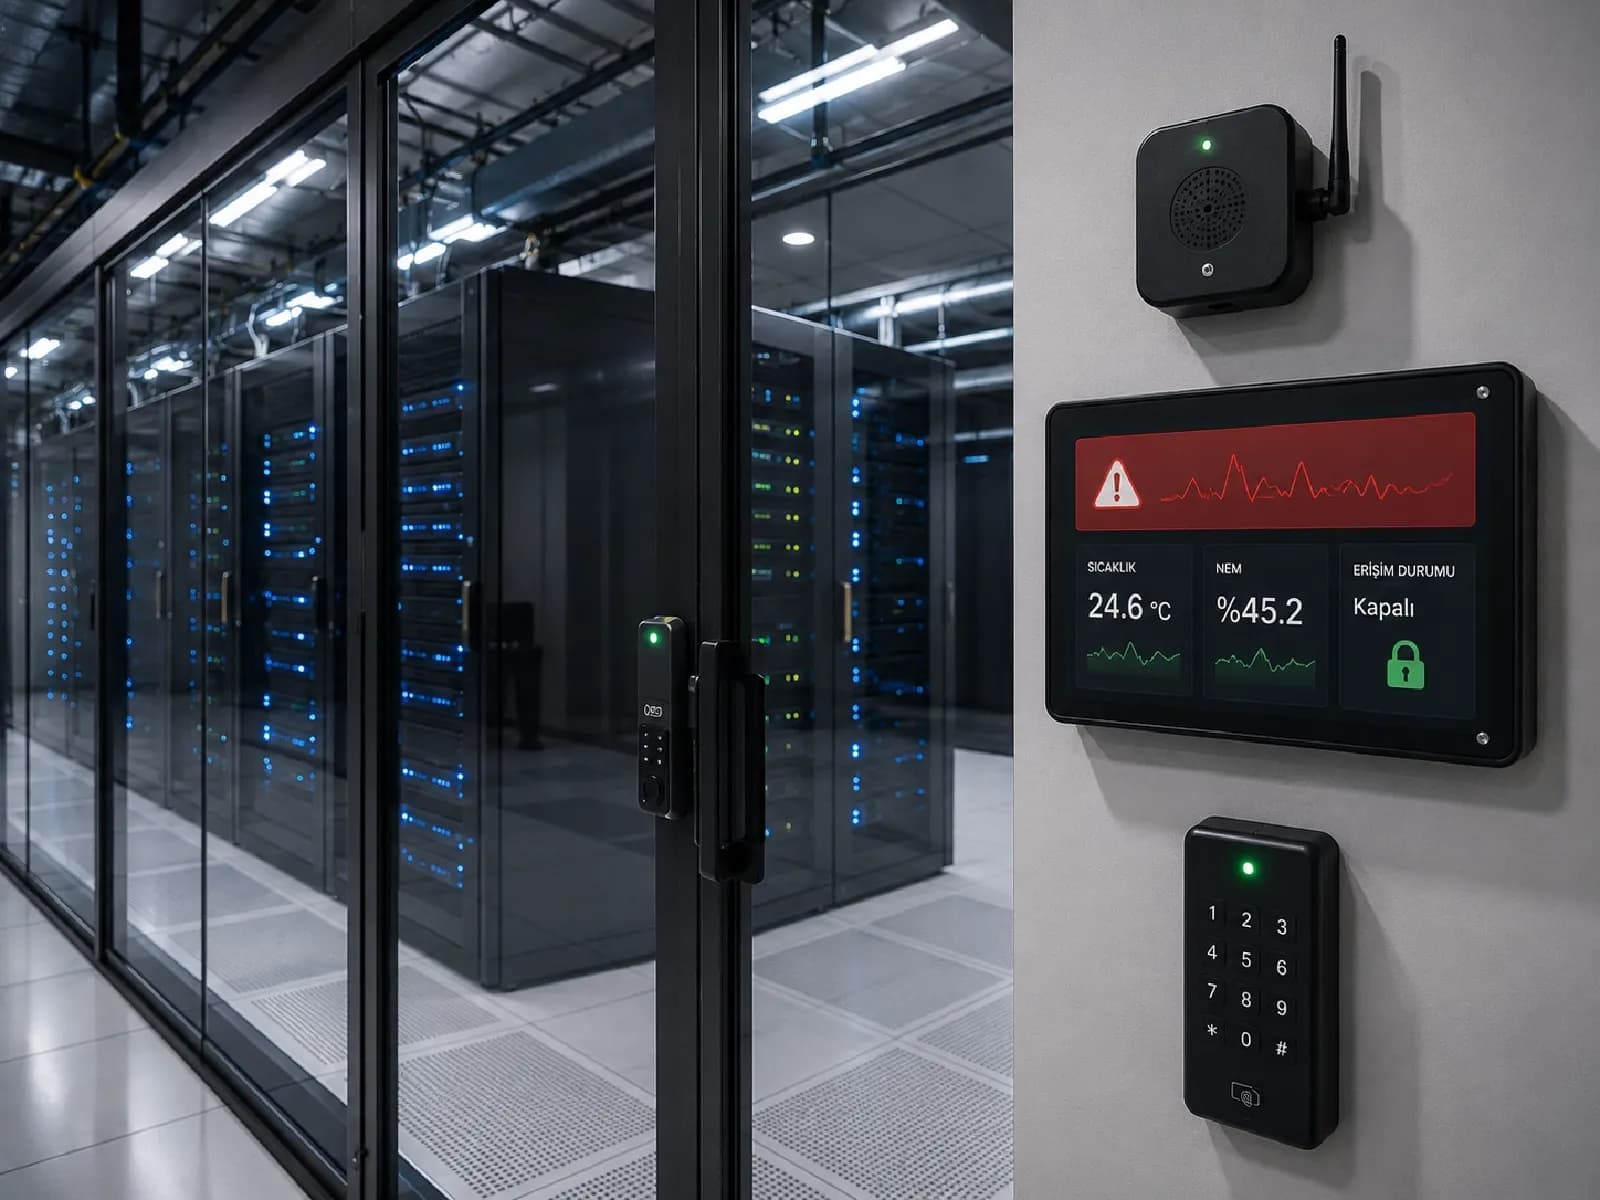
Critical Room Monitoring

Your server room should not have to wait for an inspection round.

The temperature, humidity and access status of critical areas such as server rooms, clean rooms and the cold chain are monitored continuously; an instant alarm is raised the moment there is a deviation.

  • Continuous critical area monitoring
  • Instant deviation alarm
  • Access status tracking
  • Continuous temperature, humidity and access status monitoring
  • Instant alarm generation on deviation
  • Monitoring compatible with cold chain and clean room requirements
Critical Room Monitoring — Critical Room Sensor
16 / 16

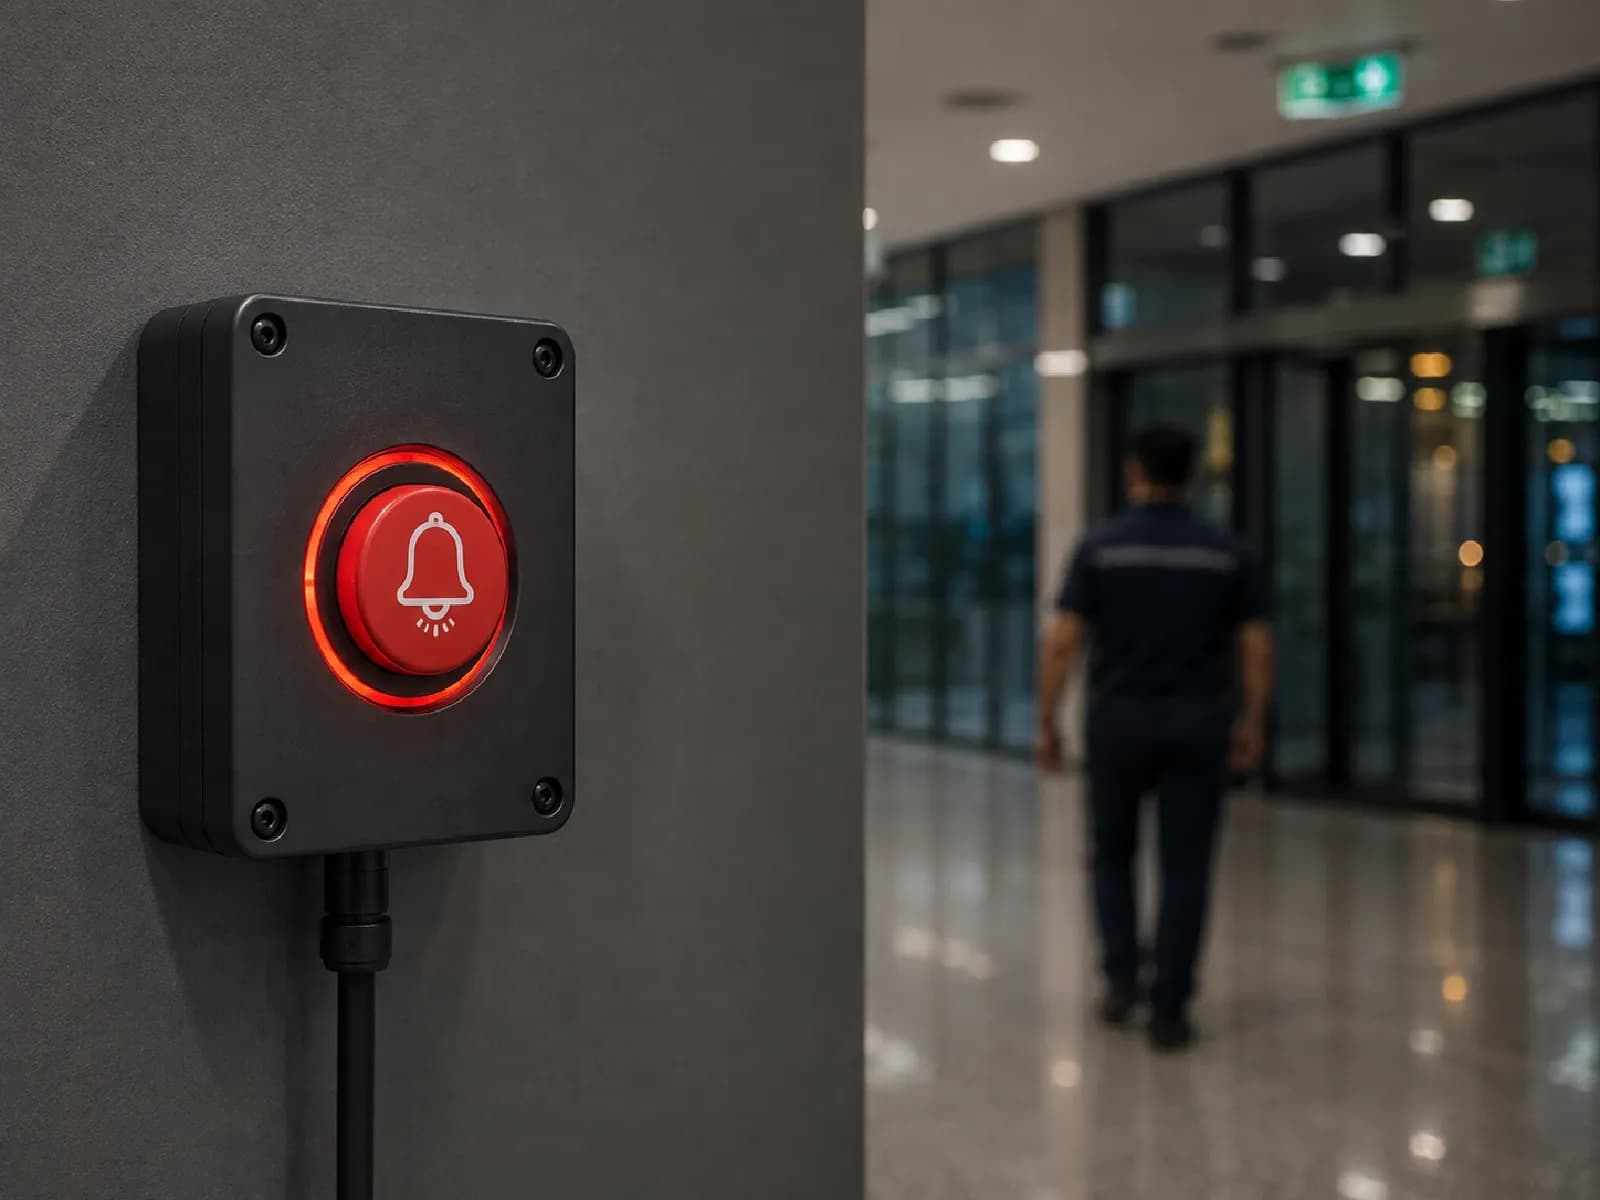
Smart Button Scenario

One touch, immediate response.

A physical or digital button scenario that triggers an emergency notification with one touch; in a power cut, security or health emergency it sends an instant alert to the field team and the management centre. Working alongside off-grid equipment, it keeps emergency lighting and communication running even during a power cut.

  • One-touch trigger
  • Instant field notification
  • Uninterrupted operation with off-grid equipment
  • A physical or digital emergency button
  • Instant alert to the field team and the management centre
  • Continuity during an outage through off-grid lighting and communication
Smart Button Scenario — Emergency Button
Nu Platform

Four ecosystems, one Nu Platform.

From urban management to energy and from industrial facilities to building management, every module above runs on the same architecture: field data is gathered in one centre, monitored in real time and turned into action.

  • Modular Architecture

    Sector-Specific Smart Modules

    A modular architecture whose modules can be added or removed as needed — start with one and grow step by step.

  • Monitoring

    Real-Time Asset Monitoring

    Every device and asset in the field is monitored on one screen, with its live status.

  • Artificial Intelligence

    AI-Based Anomaly Detection

    Abnormal consumption, fault or leak patterns are detected automatically.

  • Action

    Alarm and Event Engine

    When critical thresholds are crossed, instant notification and field coordination are triggered.

  • Reporting

    Reporting and Dashboard

    Data from every module is reported on one panel and KPIs are calculated automatically.

  • Integration

    ERP / SCADA / REST API

    Two-way data flow with enterprise systems and field protocol connectivity.

Let's Begin

Let's let your building report its own condition.

All sixteen modules share the same sensor and communication infrastructure — you can start with one and extend step by step.